|
Where are people most likely to be feeling the crypto meltdown? This geo-graphic from Statista looks at cryptocurrency use in a sampling of countries and finds widespread and growing acceptance of cryptocurrencies in India, Brazil, and South Africa: www.statista.com/chart/27070/cryptocurrency-use-selected-countries-over-time/
0 Comments
The series of geo-graphics in this article from The New York Times show how international trade with Russia has changed since February: www.nytimes.com/interactive/2022/10/30/business/economy/russia-trade-ukraine-war.html
California, by itself, is on the verge of becoming the world's 4th biggest economy, expected to pass Germany when the state's new figures come out in 2023. The world's biggest national economies, by GDP, are the U.S., China, and Japan, followed by Germany and the U.K. www.bloomberg.com/opinion/articles/2022-10-24/california-poised-to-overtake-germany-as-world-s-no-4-economy
When young adults move away from home in the U.S., where do they go? It turns out that the top destinations vary by ethnicity and parental income. New York City attracts the richest quintile of young adults, for example, but Black young adults are most likely to move to Atlanta regardless of income level. Los Angeles is the most popular destination for all but the top income quintile of White and Asian young adults and for Hispanic young adults regardless of parental income. Hispanic young adults are most likely to move to cities in the Southwest (e.g., Phoenix, San Antonio) whereas Asian young adults are most likely to move to cities in California (e.g., San Francisco, San Diego). Affluent White young adults are the only group to include Chicago among the their top five destinations. www.washingtonpost.com/business/2022/10/14/states-teachers-paddle/
The Chinese government has become one of the world's biggest lenders, especially to countries in the developing world and those associated with its Belt and Road Initiative. This map, from Statista based on World Bank data, shows which countries are most indebted to China: www.statista.com/chart/19642/external-loan-debt-to-china-by-country/
The U.S. Bureau of Economic Analysis has released data showing the impact of the first year of the COVID pandemic on arts employment, by state: www.bea.gov/system/files/inline-images/acpsa0322d.png
I was cleaning out some old papers in my office and came across this rather stunning map I had saved from 2014 showing that, as of 2013, median household income in the U.S. had peaked at least 15 years earlier in 81 percent of U.S. counties. The interactive map at The Washington Post website allows users to mouse over counties for specific data: www.washingtonpost.com/wp-stat/graphics/business/income/index.html
In the U.S., there are about 150,000 traditional gas stations and only about 6,000 fast-charging electric vehicle stations, despite the sale of more than 400,000 electric vehicles in 2021. This map, from MIT Technology Review, shows the geographic distribution of the fast-charging EV stations: www.technologyreview.com/2022/06/28/1053908/electric-vehicle-charging-stations/
El Salvador not only made Bitcoin legal tender in September 2021, it is also planning Bitcoin City, a geothermally powered, tax-free city to be funded by Bitcoin-backed bonds at the base of a volcano in the eastern part of the country. According to this recent article from Fortune, Bitcoin City is only one of several initiatives being pitched to Latin American governments by crypto enthusiasts and libertarians advocating for the creation of private, corporate-run city-states to operate outside the legal structure of the nation-state. fortune.com/2022/04/22/crypto-millionaires-building-tax-free-cities-central-america/
Shanghai is the world's busiest container port -- handling about 3x the container traffic of #2 Rotterdam -- and China's ongoing COVID lockdown of Shanghai is further gumming up global shipping. This map, based on live ship-tracking data, shows the backlog of ships earlier this week in the East China Sea, the mouth of the Yangtze River, and the Huangpu River waiting to be loaded and unloaded. cdn.statcdn.com/Infographic/images/normal/27343.jpeg
Unionizing efforts at Amazon and Starbucks have made headlines recently. In the 1970s, one in four U.S. workers was a member of a labor union. Today, the figure is roughly one in 10. This interactive map from Business Insider shows 2021 union membership by state: www.businessinsider.com/map-of-what-union-membership-looks-like-in-us-2022-1
Federal income taxes are due today. This map identifies those states that contribute the most to federal coffers. Although there is clearly a high degree of correlation with population, some states contribute significantly more than would be expected based on population alone, due to higher average wages and overall economic activity. California contributes 50% more than #2 NY, but New York is only the 4th biggest state by population. New Jersey is #11 by population but #8 by contribution to federal revenue. Massachusetts is #16 by population but #9 by federal revenue, and Minnesota is #10 by federal revenue but only #22 by population. 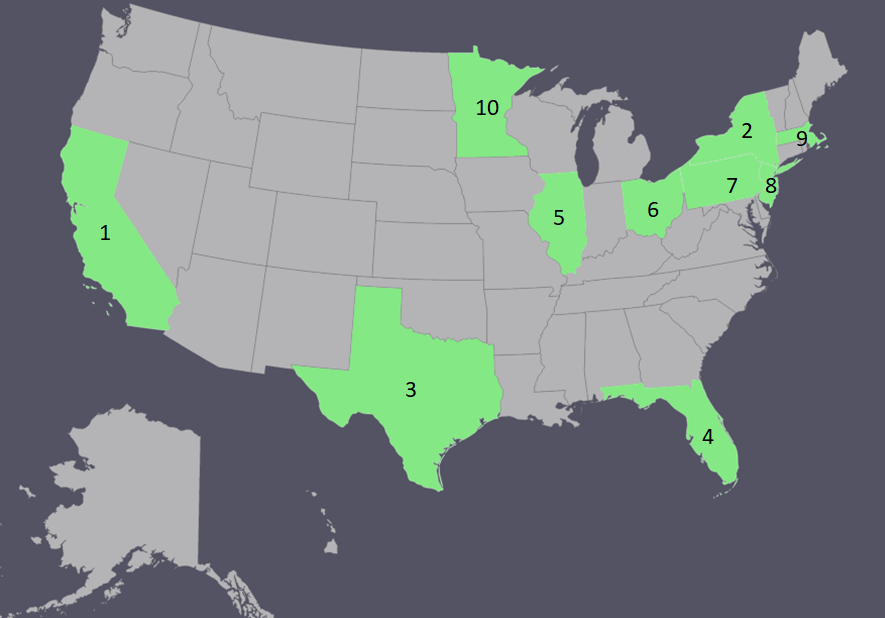 Even though continued labor shortages are giving employees the best leverage in a generation to raise their wages, the federal minimum wage remains at $7.25 per hour, meaning that many employees, especially in specific parts of the country, are still making less than $15 per hour and are particularly vulnerable to inflation driving up the costs of food and fuel. This interactive map from the British anti-poverty organization Oxfam shows the fraction of each state's labor force earning less than $15 per hour and allows users to also slice stats by race, gender, age, and marital status. www.oxfamamerica.org/explore/countries/united-states/poverty-in-the-us/low-wage-map-2022/
Historically, spring has been a busy time for home sale listings. Does the name of your street matter in terms of resale value? A recent study by a finance professor at Emory University analyzed nearly 6,000 home sales across 35 states from 2001-2020, comparing houses sold on streets with Confederate names (e.g., Jefferson Davis, Dixie) with comparable houses sold on streets without the Confederate association. The economic geography was striking in two ways. First, in the 11 states of the former Confederacy, the difference in sales prices was not statistically significant, but in the other 24 states, houses on Confederate-named streets sold for an average of 4% less -- a loss of $10,000 on a $250,000 house, for example. Second, in areas with higher shares of college educated, Democratic-voting, or Black residents, houses on Confederate-named streets sold at a bigger discount and were more likely to be slow to sell. This map shows Confederate street names in New Orleans, for example, where the city council is reconsidering place names with Confederate associations: bloximages.newyork1.vip.townnews.com/nola.com/content/tncms/assets/v3/editorial/f/ab/fab4b190-acfc-11ea-b1a5-f38812a04d2a/5ee436e73a7b7.image.jpg?resize=1333%2C1294. (Map from NOLA.com; study data from www.bloomberg.com/news/articles/2022-02-08/confederate-street-names-can-bring-lower-home-prices.)
This pair of maps, prepared by Statista based on World Bank data, shows the impact of smartphones on internet access in Africa: www.statista.com/chart/26781/internet-penetration-africa-progress/
Not surprisingly, Russia has become the most sanctioned country in the world, with nearly 6,000 different sanctions targeting individuals and/or governmental entities. This geo-graphic from Statista looks at the countries with the most international sanctions. cdn.statcdn.com/Infographic/images/normal/27015.jpeg
Tulips, as both bulbs and cut flowers, are strongly associated with the Netherlands. But the Netherlands' dominance in floriculture extends far beyond tulips. In fact, the Aalsmeer Flower Market, southwest of Amsterdam, oversees the distribution of 43 million cut flowers every day! Flowers are flown into Aalsmeer from all over the world, sorted, graded, auctioned, and rapidly distributed across Europe. The building in which the flower auction is held is the fourth largest building in the world by footprint, roughly the size of 200 soccer fields. www.visitaalsmeer.nl/wp-content/uploads/2021/06/RoyalHolland-Flower-Auction-Aalsmeer-1-1920x1440.jpg
With some states, including Maryland and Georgia, temporarily lowering state gasoline taxes to reduce the impact of rising oil prices at the pump, this topological map compares state gas taxes, which range from a low of 15¢ per gallon in Alaska to a high of 70¢ per gallon in California. (Map from the print edition of www.wsj.com/articles/maryland-georgia-pause-gas-taxes-with-prices-near-record-highs-11647880317.)
This map from Bloomberg combines educational attainment and prevalence of knowledge/professional/creative jobs to identify the top U.S. metropolitan areas for knowledge work. Top regions for knowledge work: the San Francisco Bay area, the Boston area, and the Washington, DC area. Between 2010 and 2019, San Francisco saw the most growth in knowledge workers, followed by Pittsburgh and St. Louis. (Map from www.bloomberg.com/news/articles/2022-02-16/the-top-u-s-cities-for-knowledge-workers.)
'Because fossil fuels (and military hardware) are Russia's only exports of note, some observers have speculated that Russia is making a play for Ukraine now because, with the anticipated decline of fossil fuels, it will not have the resources to do so in the future. This piece, from a pair experts on energy politics, gives several reasons why it's a mistake to view Russia -- or any fossil fuel autocracy -- as a dying petrostate.
"First, this period [the next 10 to 20 years] will be marked by significant price volatility, which will give a very limited number of producers with the ability to supply more oil or gas in short order extra geopolitical influence. ...The clean energy transition risks bringing with it more price volatility because of mismatches between supply and demand caused by insufficient energy investments. ... Global investment in oil and gas is now at record lows as a result of uncertainty about the outlook for demand in a world more serious about climate and the terrible financial performance of the oil sector over the past decade. This low level of oil and gas investment would be welcome if it were because demand was falling or investment in clean energy was rising at a rate to offset the fall in investment. But oil and gas use are both rising and projected to continue doing so for years. ... Second, as oil and natural gas production shifts away from large, Western, publicly held oil and gas companies, oil companies owned by the countries in which vast resources are found will be able to flex their muscles more. ... Third, even in a net-zero global economy, substantial amounts of oil and gas will still be required in the energy mix. ... From France’s 'yellow vest' protests to Kazakhstan’s recent unrest over fuel price hikes, it is increasingly clear that if climate ambition comes into tension with energy reliability or affordability or the security of energy supplies, climate ambition will lose. As energy prices soar, preparing for crises in which state-controlled energy suppliers are able to exert outsize geopolitical and economic clout must be a priority for Western leaders." www.nytimes.com/2022/01/27/opinion/ukraine-russia-europe-gas.html This map from Statista, using data from MIT's "living wage calculator," shows the gap between the minimum wage in a state and the living wage for a single worker with no children. Hawaii has the largest gap -- $9.33 -- because of the state's extremely high cost of living; Washington has the smallest gap, presumably because of the state's relatively high minimum wage ($13.69 when this study was done and $14.49 as of earlier this month). cdn.statcdn.com/Infographic/images/normal/25574.jpeg
In 2019, fatal injuries cost the U.S. economy $2.2 trillion. This series of maps from the Centers for Disease Control reflect these costs by state, with West Virginia, New Mexico, and Alaska suffering the highest per-capita economic losses. [Fatal injuries include drug overdoses (25%), suicides (20%), falls (16%), motor vehicle accidents (15%), and homicides (8%).] www.cdc.gov/mmwr/volumes/70/wr/figures/mm7048a2-F.gif
This map, from The Wall Street Journal, shows the states most affected by the Great Resignation this year. (from www.wsj.com/articles/where-u-s-workers-are-quitting-jobs-at-record-rates-11637836201)
This map compares the per capita GDP (adjusted for purchasing power parity) of Mexico's 32 states with countries with equivalent per capital GDPs. (The darker the color, the higher the per capita GDP.)
www.reddit.com/r/MapPorn/comments/q3ozzq/mexican_states_as_countries_by_gdp_per_capita_ppp/ This map from the Brookings Institution shows where in the U.S. artificial intelligence skills are currently in demand (in dark and light purple) and where they could be in the future, based on government R&D spending (in yellow and orange): www.brookings.edu/wp-content/uploads/2021/08/metro_geography_of_ai_map1.png (From www.brookings.edu/blog/the-avenue/2021/09/16/five-charts-that-reveal-the-geography-of-the-ai-economy/)
|
Blog sharing news about geography, philosophy, world affairs, and outside-the-box learning
Archives
December 2023
Categories
All
|
 RSS Feed