|
This geo-graphic from Statista looks at which metro areas have the most installed data farm capacity: www.statista.com/chart/31372/regions-cities-with-highest-data-center-power-capacity
0 Comments
Engineers argue for concrete construction in hurricane-prone areas. Wood is cheaper, though, even after taking higher homeowners insurance costs into account. This map shows current and recent wood construction projects in Florida, including high-rise buildings, with a concentration in the Jacksonville area and along the Gulf Coast. (Map from www.wsj.com/real-estate/in-hurricane-prone-florida-builders-are-still-making-new-homes-out-of-wood-d3fcb931.)
COVID and geopolitics have played a role in the shifting composition of international students at U.S. colleges and universities. This geo-graphic from Statista looks at international student enrollment, at the undergraduate and graduate levels, across the U.S.: www.statista.com/chart/20010/international-enrollment-in-higher-education/
The UN's annual COP climate conference gets underway in Dubai today. This map looks at where fossil fuel use for generating electricity is growing and shrinking around the world. (Map from www.nytimes.com/interactive/2023/11/20/climate/global-power-electricity-fossil-fuels-coal.html. More country-specific charts in the article.)
Redevelopment in Mumbai is replacing some of the megacity's first housing, the "chawls," cheap tenement housing that has long served as an affordable entry point for new arrivals in the city. "The development of Mumbai’s chawls tells a story whose outline is common to many megacities. The buildings sprang up during the British Raj, a time when new urban jobs were luring people in their thousands away from the countryside for work in textiles or as dockworkers in one of the busiest ports in Britain’s global empire. The growth of chawls can be thought of almost as synonymous with the expansion of the city. Before Bombay became a key harbor for trade and the British navy, the region was inhabited by small fishing communities. This transformation was powered partly by events in North America, as textile manufacturing boomed when the US Civil War cut off transatlantic cotton exports to Europe.This boom fueled a desperate need for cheap housing, and chawls were a common answer. Typically built around a central courtyard, the chawls grouped rooms around a corridor, divided into either single or double room units, with bathrooms usually shared between the residents of each floor. This arrangement would perhaps have been ample with one or two workers per unit. In practice, this was never how they were used in India, where multiple generations — uncles, aunts, grandparents and cousins — shared space. ... Yet the chawls still offered (and continue to offer) benefits. Their density and grouping around courtyards — which still today continue to be the focus of activities like community sports, religious festivals and weddings — helped to generate camaraderie and community spirit between households. For low-income families in an expensive city, they offer a semblance of a safety net that the state doesn’t provide. The solidarity they generate is especially helpful for those needing help with child-care or in creating opportunities to socialize for older residents." www.bloomberg.com/news/features/2023-11-01/mumbai-chawl-tenements-helped-build-the-megacity-but-they-are-under-threat
This topological map looks at the growth of home schooling in the U.S. since the 2017-18 school year. Because quite a few states do not require any notification from or oversight of home schoolers, no data is available for some states. (Map from www.washingtonpost.com/education/interactive/2023/homeschooling-growth-data-by-district/.)
Of the roughly 225 hostages Hamas captured in Israel and is holding in Gaza, 54 are Thai nationals. Thai nationals also make up the largest group of foreigners killed by Hamas on Oct. 7. This article from Quartz looks at issues surrounding the prevalence of Thai migrant workers in Israel's agricultural sector: qz.com/why-so-many-hamas-hostages-are-from-thailand-1850963541
This geo-graphic plots state cigarette taxes against state smoking-related death rates. (Graphic from www.washingtonpost.com/health/interactive/2023/republican-politics-south-midwest-life-expectancy/.)
In the past year, more than 500 schools in the U.S. have been subjected to fake calls about school shooters. This map looks at the prevalence of fake school shooter calls, by state, in that time. (Map from www.washingtonpost.com/nation/2023/10/04/school-swatting-hoax-active-shooter/.)
This 523 boarding schools shown on this map represent the most complete accounting to date of Native American boarding schools in the U.S., the first of which opened in 1801 and the last of which opened as late as the 1970s. (Map from www.nytimes.com/interactive/2023/08/30/us/native-american-boarding-schools.html.)
A confluence of factors -- including concentrated wealth searching for investment outlets and rising interest rates -- is leading to a growing proportion of single-family homes in the U.S. being purchased for cash and turned into rental housing. This map takes as a case study a middle-class neighborhood in Charlotte, NC. (Map from www.nytimes.com/interactive/2023/09/16/realestate/home-sales-north-carolina-wall-street.html.)
Fast forward to 2050: this geo-graphic from Statista looks at the anticipated number of retirees per 100 working people, in selected countries, in 2020 vs. 2050. Numbers in 2050 range from 40.4 retirees per 100 working people in the U.S. to 80.7 (!) retirees per 100 working people in Japan. The length of the bar highlights the change in value from 2020 to 2050. www.statista.com/chart/30831/evolution-of-the-number-of-retirees-per-100-working-people
This geo-graphic from Statista, based on UN data, shows how patterns in human migration have changed over the last 20 years: www.statista.com/chart/30815/top-destination-countries-for-international-migrants
This satellite image, from Al Jazeera, shows the location of the two dams on the Wadi Derna in far northeastern Libya that collapsed earlier this week following unusually heavy rains. The dams were built in the 1970s by a Yugoslavian company as part of a project to provide reservoirs and an irrigation network for communities in the region. Although Libya is not considered especially vulnerable to climate change, Notre Dame's Global Adaptation Initiative had previously flagged Libya's dam capacity as a significant vulnerability. www.aljazeera.com/wp-content/uploads/2023/09/INTERACTIVE-Libya-Derna-floods-Storm-Daniel-1694506930.png
If your state doesn't produce enough doctors to meet demand, where are the doctors in your state most likely from? This map, based on U.S. Census data, answers that question. (Map from www.washingtonpost.com/business/2023/08/18/states-most-artists-writers/.)
Most people are familiar with the concept of life expectancy. Less familiar are the many variants on life expectancy, including "healthy life expectancy" (HALE), which is defined by the World Health Organization as the "average number of years that a person can expect to live in 'full health' by taking into account years lived in less than full health due to disease and/or injury." This map shows the countries with the largest gap between life expectancy and healthy life expectancy -- or, thought of another way, with the most years of unhealthy old age -- as of 2019. The U.S. tops the list, with a gap of 12.4 years, followed by Australia, at 12.1 years. Completing the top 10 are New Zealand, the UK, Norway, Spain and Italy (tied), Iran, and Canada, Kuwait, and Switzerland (tied). 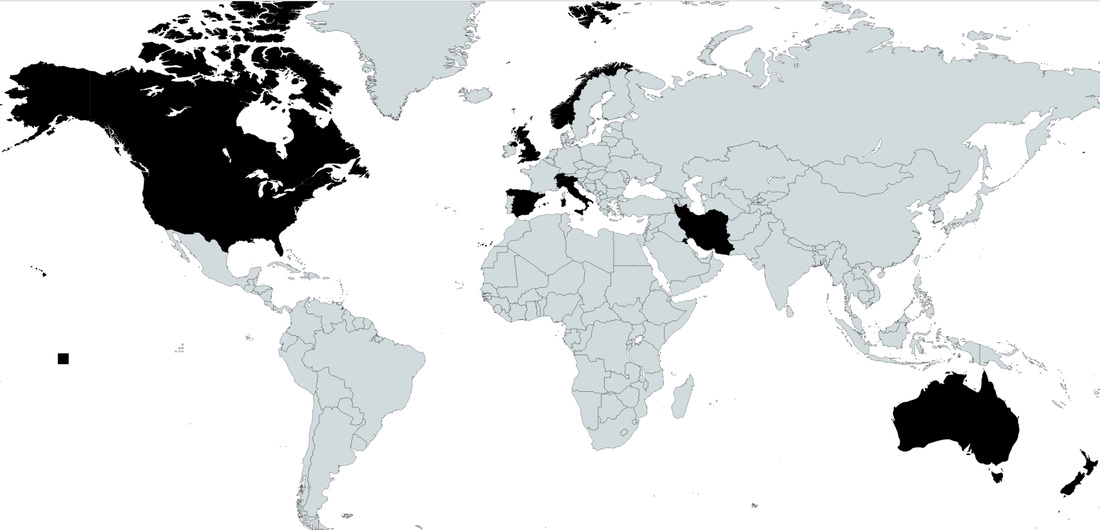 Which states produce the most physicians per capita? According to the Census Bureau, as shown on this map, the District of Columbia, New York, and Utah have produced the most people employed as physicians over the last 10 years. (Map from www.washingtonpost.com/business/2023/08/18/states-most-artists-writers/.)
Crash Map maps fatal car crashes across the contiguous U.S. by state, by county, and by date. In many states, August is among the worst months for fatal car crashes. nextbase.com/crash-map
The 2023 Global Terrorism Index has been released, showing that Sub-Saharan Africa, particularly the Sahel, has become the global hotspot for terrorism, with the Sahel now accounting for 43% of all deaths due to terrorism. The U.S. is still #30 on the list, just behind Benin and Sri Lanka, but in 2022 recorded the fewest attacks classified as terrorism since 2012. www.visionofhumanity.org/maps/global-terrorism-index/#/
This series of maps and images compares current vistas around the world with images predicting how those same vistas might change based on a 1.5°C increase in global temperatures and a 3°C increase in global temperatures: picturing.climatecentral.org/
If the runaway success of Barbie has left you craving more pink in your life, Conde Nast Traveler has picked out the world's most beautiful pink places, from Florida to Jaipur to Spain to Vietnam to Scotland: www.cntraveler.com/gallery/the-most-beautiful-pink-places-to-visit-around-the-world
This map was made by showing all of the domestic flights within each country: comparemyjet.com/domestic-flights-only/
Facing ongoing drought conditions, Spain is one of several countries looking to resurrect water-delivery systems hundreds or thousands of years old. This article is about Spain's acequias system, an extensive network of canals originally built by the Moors to deliver water from the mountains to communities across southern Spain. www.nytimes.com/2023/07/19/world/europe/spain-drought-acequias.html
With donors on vacation, blood supplies tend to dip in the summer. This map shows the statistically dominant blood type in each country: cdn.statcdn.com/Infographic/images/normal/28156.jpeg
Students who have taken my "Your Future World: Human Geography 2050" class will be familiar with the demographic shifts highlighted in this graphic, based on UN data and forecasts, that will shape the world in which they live. www.statista.com/chart/29853/the-worlds-most-populous-countries-since-1950 (I expect to teach "Your Future World" online for the first time in Spring 2024.)
|
Blog sharing news about geography, philosophy, world affairs, and outside-the-box learning
Archives
December 2023
Categories
All
|
 RSS Feed