|
The Darién Gap is a roadless region of tropical rainforest connecting North and South America; the "gap" refers to the gap in the Pan-American Highway in this section of southern Panama and northern Colombia. Since the economic disintegration of Venezuela in 2018, the Darién Gap has also emerged as a primary, if arduous, transit corridor for migrants trying to get from South America to Mexico and the U.S. This article from the New York Times looks at the how the Darién Gap has become a major cash cow, not just for smugglers but also for entrepreneurs and local officials in what is effectively a space outside central government control. Trafficking migrants across the Darién Gap is described as "the only profitable industry in a place that didn’t have a defined economy before.” www.nytimes.com/2023/09/14/world/americas/migrant-business-darien-gap.html
0 Comments
This map and geo-graphic from Statista looks at extreme poverty -- defined by the World Bank as a daily income of $2.15 or less -- in selected countries before the COVID epidemic. www.statista.com/chart/30742/people-living-in-extreme-poverty-country-share/
This article from Fortune introduces readers to Gatun Lake, a body of water you may have never heard of or thought about that is poised to play a huge role in global trade, supply chain management, and inflation because of a severe, ongoing drought in Panama:
"Federal Reserve Chair Jerome Powell keeps careful track of employment levels, wages, consumer prices and numerous other metrics to see where the US inflation rate may be headed in the next year. He might also want to keep an eye on water levels at Gatun Lake. That’s the lake that feeds the locks in the Panama Canal with the fresh water needed to raise vessels as they pass from the Pacific Ocean to the Atlantic. But a severe drought has caused water levels in the lake to drop far below normal, resulting in weight limits and rising surcharges for vessels traversing the canal. It’s also unnerving economists and supply-chain experts. Just as the world’s delivery bottlenecks are easing, Panama’s drought and worrisome weather patterns elsewhere threaten to revive some of the chaos of 2021, when a surge in shipping costs and consumer demand resulted in shortages of goods, helping to drive US inflation to a four-decade high. If Gatun Lake levels keep falling as forecast, the market reaction will be higher shipping rates and a scramble to find alternative routes from Asia to the US, logistics experts said. ... Making matters worse, an El Niño system is building in the western Pacific Ocean and is expected to upset normal weather patterns by the end of this year. While this can cause heavy rainfall in some regions, in Panama it typically means severe drought and higher than normal temperatures." fortune.com/2023/06/02/panama-canal-water-levels-drought-inflation/ Just 29 countries (shown in yellow) contribute more than half of the world's maternal deaths, newborn deaths, and stillbirths: reliefweb.int/map/world/map-2023-countries-un-humanitarian-appeals-contribute-global-maternal-deaths-newborn-death-and-stillbirths
Valentine's Day is a major chocolate-giving holiday. This site has an interesting collection of links related to the geography of chocolate: cocoarunners.com/the-geography-of-chocolate/
Working on behalf of a free press and the public's right to know is often a dangerous job. War zones figure into this map showing where the most journalists were killed in 2022, but Mexico continues to be the most dangerous place to be a journalist: cdn.statcdn.com/Infographic/images/normal/1181.jpeg
The second major named storm of the Atlantic hurricane season has just made its way across Cuba and Florida. This map, based on the INFORM Risk Index, looks at the risk of hurricane-related humanitarian crises in Latin America and the Caribbean: cdn.statcdn.com/Infographic/images/normal/28317.jpeg
Plants, animals, and microbes move around based on changes in the physical environment and human activity. This shifting geography was documented recently by the appearance in southern Mississippi of a dangerous microbe previously found only in tropical and subtropical zones, including northern Australia, parts of Central and South America, and South and Southeast Asia: www.nytimes.com/2022/07/27/health/deadly-bacteria-us-soil-water.html
Reporters Without Borders has released its 2022 assessment of press freedom in 180 countries and territories. Notably, Central and South America saw serious declines in press freedoms over the last year, with Honduras, Nicaragua, Chile, Uruguay, Bolivia, Colombia, and Venezuela all dropping at least 11 (and as many as 39) positions in global rankings. Users can mouse over the map for details or click on the "Analyses 2022" for details: rsf.org/en/index
El Salvador not only made Bitcoin legal tender in September 2021, it is also planning Bitcoin City, a geothermally powered, tax-free city to be funded by Bitcoin-backed bonds at the base of a volcano in the eastern part of the country. According to this recent article from Fortune, Bitcoin City is only one of several initiatives being pitched to Latin American governments by crypto enthusiasts and libertarians advocating for the creation of private, corporate-run city-states to operate outside the legal structure of the nation-state. fortune.com/2022/04/22/crypto-millionaires-building-tax-free-cities-central-america/
Not surprisingly, Russia has become the most sanctioned country in the world, with nearly 6,000 different sanctions targeting individuals and/or governmental entities. This geo-graphic from Statista looks at the countries with the most international sanctions. cdn.statcdn.com/Infographic/images/normal/27015.jpeg
Egypt was once the bread basket of the ancient world. Today, it is the world's biggest importer of wheat. This map features the 10 biggest importers of wheat over the last 4 years -- with Egypt, Indonesia, and Turkey in the top three -- suggesting these countries are likely to feel the pinch of rising wheat prices and possible wheat shortages with Russian and Ukrainian wheat off the market. Egypt's heavy reliance on imported wheat coupled with its long political tradition of subsidizing bread makes it particularly vulnerable to crisis. 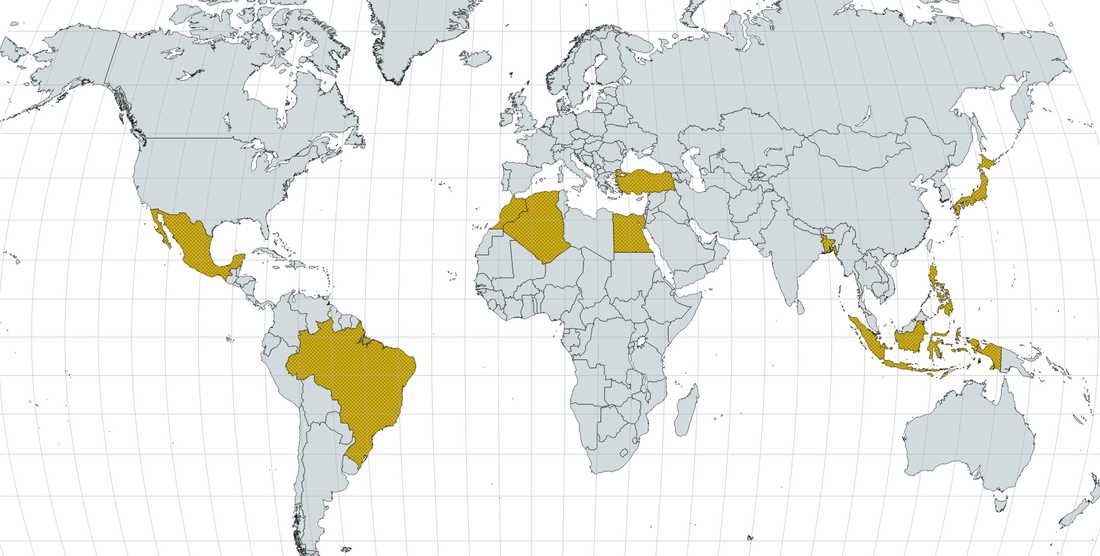 According to a recent report by the International Work Group for Indigenous Affairs, an estimated 4.3 million Americans (corresponding to 1.3% of the U.S. population) is Native American. In Bolivia, by contrast, nearly half of the population is indigenous. www.statista.com/chart/19633/countries-by-indigenous-population-in-the-americas
This map compares the per capita GDP (adjusted for purchasing power parity) of Mexico's 32 states with countries with equivalent per capital GDPs. (The darker the color, the higher the per capita GDP.)
www.reddit.com/r/MapPorn/comments/q3ozzq/mexican_states_as_countries_by_gdp_per_capita_ppp/ With Major League Baseball playoffs working their way to the World Series, sports geographer (and geography professor) Ted Goudge looked at which states produce the most MLB players: California is the #1 source of this year's professional baseball players, followed by the Dominican Republic, and Florida. (30% of current MLB players grew up outside the U.S.) www.kmaland.com/news/geography-with-goudge-mlb-players-2021/article_beade15c-25f6-11ec-8680-134d4c576c1a.html
Argentina recently released data showing that more than 40% of the country's population is living in poverty, with nearly 11% of the population classified as destitute (extreme poverty). The country had been in recession since 2018 and coronavirus-related shutdowns caused Argentina's GDP to sink an additional 9.9% from spring 2020 to spring 2021, devastating the country's middle class and youth. Income inequality has long had clear geographic patterns in Argentina, with the highest rates of poverty in the north and the lowest rates in and around Buenos Aires. www.reddit.com/r/MapPorn/comments/klpiuh/persistent_poverty_rates_in_argentina_by/
This geo-graphic looks at who was granted asylum in the U.S. in FY2019, by country of origin, and how that mix has been changing. www.statista.com/chart/25619/asylum-grants-in-the-us-by-nationality
"Extirpation" is one the biogeography terms my geography students learn in the course of their studies. This map shows the current range of the jaguar (in green) as well as its historic range, from which the jaguar has been extirpated (in yellow).
c402277.ssl.cf1.rackcdn.com/photos/22252/images/magazine_medium/Jaguar_map2_WWfall2021.png (Map from www.worldwildlife.org/magazine/issues/fall-2021/articles/restoring-the-jaguar-corridor.) And therein lies the rub: just days after the UN Intergovernmental Panel on Climate Change releases its bleak report on global warming, the Biden White House asks the OPEC+ group to pump more oil to bring down gasoline prices, which are at or near a seven-year high. OPEC+ refers to the official members of the Organization of Petroleum Exporting Countries, shown in dark blue on this map, and other major petroleum producers who often coordinate with OPEC but are not members of OPEC, shown in light blue on this map. www.insightsonindia.com/wp-content/uploads/2020/03/Break_through.png
Vice President Kamala Harris's recent trip to Guatemala to discuss illegal immigration reflects Guatemala's status as the #1 source country for people apprehended by the U.S. Border Patrol trying to gain illegal entrance to the United States. This map shows the top 10 source countries in FY2019, which is the most recent annual data released by the U.S. Border Patrol showing citizenship. The top two countries, by far, are Guatemala and Honduras which, together, accounted for more than 60% of all apprehensions. 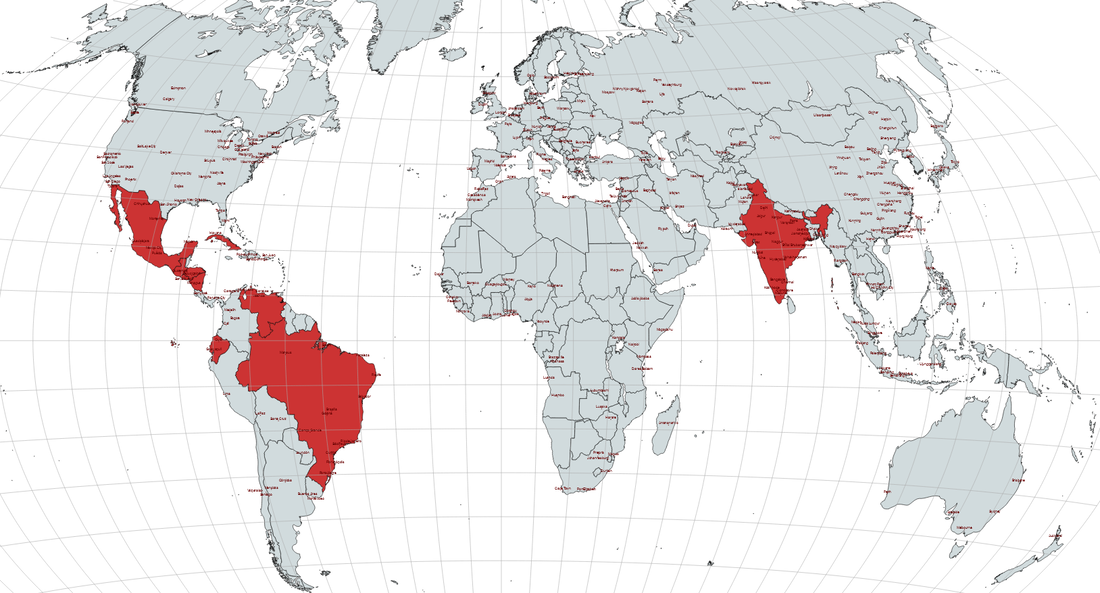 A recent assessment by the World Bank and International Monetary Fund finds that the combination of debt, exacerbated by the coronavirus pandemic, and climate change may push a growing number of countries to the brink -- and, with them, the global economy if action is not taken.
"Take Belize, Fiji and Mozambique. Vastly different countries, they are among dozens of nations at the crossroads of two mounting global crises that are drawing the attention of international financial institutions: climate change and debt. ... One of the countries at the crossroads of the climate and debt crises is Belize, a middle-income country on the Caribbean coast of Central America. Its foreign debt had been steadily rising for the last few years. It was also feeling some of the most acute effects of climate change: sea level rise, bleached corals, coastal erosion. The pandemic dried up tourism, a mainstay of its economy. Then, after two hurricanes, Eta and Iota, hit neighboring Guatemala, floods swept away farms and roads downstream in Belize. Today, the debt that Belize owes its foreign creditors is equal to 85 percent of its entire national economy. The private credit ratings agency Standard & Poor’s has downgraded its creditworthiness, making it tougher to get loans on the private market. The International Monetary Fund calls its debt levels 'unsustainable.' ... Both the World Bank and the International Monetary Fund are important lenders, but so are rich countries, as well as private banks and bondholders. The global financial system would face a huge problem if countries faced with shrinking economies defaulted on their debts. ... "And then there’s Mozambique. The sixth-poorest country in the world. It was already sinking under huge debts, including secret loans that the government had not disclosed, when, in 2019, came back-to-back cyclones. They killed 1,000 people and left physical damages costing more than $870 million. Mozambique took on more loans to cope. Then came the pandemic. The I.M.F. says the country is in debt distress. Six countries on the continent are in debt distress, and many more have seen their credit ratings downgraded by private ratings agencies. In March, finance ministers from across Africa said that many of their countries had spent a sizable chunk of their budgets already to deal with extreme weather events like droughts and floods, and some countries were spending a tenth of their budgets on climate adaptation efforts. 'Our fiscal buffers are now truly depleted,' they wrote. In developing countries, the share of government revenues that go into paying foreign debts nearly tripled to 17.4 percent between 2011 and 2020, an analysis by Eurodad, a debt relief advocacy group found." www.nytimes.com/2021/04/07/climate/debt-climate-change.html If you have noticed bananas crept up in price this year, it's for the same reason the majority of families and unaccompanied minors at the U.S.-Mexico border are from Honduras and Guatemala: Eta and Iota, the back-to-back Category 4 hurricanes that devastated swaths of Central America last November. The destruction stunned even disaster relief veterans. This recent article from The New York Times looks at this unfortunate collision of physical geography and human geography. www.nytimes.com/2021/04/06/world/americas/migration-honduras-central-america.html
Because warmer air can hold more moisture, humidity is expected to rise along with global temperatures. A recent study published in Nature Geoscience suggests that the combination could push human life in the tropics to the breaking point. "Humans’ ability to regulate their body heat is dependent upon the temperature and humidity of the surrounding air. We have a core body temperature that stays relatively stable at 37C (98.6F), while our skin is cooler to allow heat to flow away from the inner body. But should the wet-bulb temperature – a measure of air temperature and humidity – pass 35C, high skin temperature means the body is unable to cool itself, with potentially deadly consequences. ... The research team looked at various historical data and simulations to determine how wet-bulb temperature extremes will change as the planet continues to heat up, discovering that these extremes in the tropics increase at around the same rate as the tropical mean temperature. ... This has potentially dire implications for a huge swathe of humanity. Around 40% of the world’s population currently lives in tropical countries, with this proportion set to expand to half of the global population by 2050 due to the large proportion of young people in region. The Princeton research was centered on latitudes found between 20 degrees north, a line that cuts through Mexico, Libya and India, to 20 degrees south, which goes through Brazil, Madagascar and the northern reaches of Australia. ... '“Theoretically no human can tolerate a wet bulb temperature of above 35C, no matter how much water they have to drink,' [Boise State climate risk expert Mojtaba Sadegh] added."
www.theguardian.com/science/2021/mar/08/global-heating-tropical-regions-human-livability This geo-graphic looks at extreme poverty around the world (measured as living on $1.90 per day or less). If one can believe the numbers, it is worth noting that China's extreme poverty rate is now the same as that of the U.S., Japan, Canada, and Norway, among others. The size of the circle in each band reflects the number of people in extreme poverty. howmuch.net/articles/extreme-poverty-around-world
Recent protests and elections in Chile and Argentina, respectively -- countries generally considered among South America's wealthiest -- have highlighted a high level of public dissatisfaction. This map, from The Economist (UK) and based on 2018 data, looks at the proportion of adults across Latin America who agree that they want to leave their country. Not surprisingly, countries like Venezuela (hyperinflation), Honduras and El Salvador (violence), and Haiti (poverty) rank highly, but nearly 1/3 of adults across the region want to emigrate. www.economist.com/graphic-detail/2019/09/07/nearly-a-third-of-latin-americans-want-to-emigrate
|
Blog sharing news about geography, philosophy, world affairs, and outside-the-box learning
Archives
December 2023
Categories
All
|
 RSS Feed