|
Israel depends on foreign labor in its agricultural sector, which accounts for the large number of Thai citizens kidnapped by Hamas on Oct. 7. Since the war began, an estimated 15,000 farmworkers have left Israel. This week the African country of Malawi announced that it is sending at least 5,000 replacement farmworkers to Israel. The deal was announced "two weeks after the Israeli government announced a $60 million aid package for Malawi," one of the world's poorest countries as measured by per capita GDP. www.nytimes.com/live/2023/11/28/world/israel-hamas-gaza-war-news#malawi-plans-to-send-thousands-of-farmworkers-to-israel
0 Comments
This article from Geographical (UK) explores the physical and cultural geography of China: geographical.co.uk/culture/geo-explainer-the-many-chinas
A confluence of factors -- including concentrated wealth searching for investment outlets and rising interest rates -- is leading to a growing proportion of single-family homes in the U.S. being purchased for cash and turned into rental housing. This map takes as a case study a middle-class neighborhood in Charlotte, NC. (Map from www.nytimes.com/interactive/2023/09/16/realestate/home-sales-north-carolina-wall-street.html.)
This map and geo-graphic from Statista looks at extreme poverty -- defined by the World Bank as a daily income of $2.15 or less -- in selected countries before the COVID epidemic. www.statista.com/chart/30742/people-living-in-extreme-poverty-country-share/
In the context of last week's BRICS [Brazil-Russia-India-China-South Africa] summit, there was much discussion of "the Global South." Unfortunately, there's no line on a map that denotes where the Global South begins or ends. The term is meant to call attention to the idea that countries in the Tropics and Southern Hemisphere (roughly south of 30° N latitude) are less economically and politically developed than their neighbors to the north. Even though this generalization is borne out along many metrics -- including GDP per capita, human development, political fragility, etc. -- some of the world's most affluent, developed countries are also in this region (including Australia, New Zealand, Singapore, and the United Arab Emirates) and would be excluded from the term Global South. Today, "the Global South" is most often used in lieu of terms like "Third World countries" or "developing countries." This map shows one take on the Global South (in red):
upload.wikimedia.org/wikipedia/commons/thumb/6/6d/Global_North_and_Global_South.svg/1200px-Global_North_and_Global_South.svg.png Although not population adjusted, this map from Statista highlights the U.S. states that make above-average contributions to U.S. GDP and notes a few that punch above their weight (California, Massachusetts, New York) and below their weight (Florida): www.statista.com/chart/9358/us-gdp-by-state-and-region
This geo-graphic from Statista highlights the world's top net exporters and importers in 2022, with exports continuing to be driven by fossil fuels and manufacturing: cdn.statcdn.com/Infographic/images/normal/18356.jpeg
Tourism was up sharply in 2022, but ticket sales at some of the world's most famous art museums still lagged pre-pandemic levels, in some cases by more than 30%, as this geo-graphic from Statista shows: cdn.statcdn.com/Infographic/images/normal/30018.jpeg
The Bahamas was the first country to roll out a digital currency, the Sand Dollar, in 2020. This map from Statista shows where digital currencies are currently being used, piloted, under development, or considered: www.statista.com/chart/24571/central-bank-digital-currencies-around-the-world
What makes for a competitive business climate? According to the International Institute for Management Development, it's a mix of 336 variables in four broad categories measuring a country's economic performance, government efficiency, business efficiency, and infrastructure. This year's analysis of 64 country's has just been released, with Denmark on top for the 2nd year in a row and a Middle East country, the UAE, breaking the top 10 for the first time. For more about the rankings and the methodology, see www.imd.org/centers/wcc/world-competitiveness-center/rankings/world-competitiveness-ranking/2023/
Because they often rely on evaporative cooling to keep equipment from overheating, data centers rank among the top 10 most water-consuming industries in the U.S. This article explores the clash between Big Tech and local communities in water-stressed areas of the U.S. www.washingtonpost.com/climate-environment/2023/04/25/data-centers-drought-water-use/
The headlines associated with the first geo-graphic in this article tend to focus on hot job creation rates in politically "red" vs. "blue" states. This analysis, though, goes deeper into the hiring numbers to discuss connections with job churn, wages, education, and housing: www.washingtonpost.com/business/2023/05/26/hiring-red-blue-states/
It's well known that bitcoin mining uses an enormous amount of electricity, but what does that look like on the ground? In this article, The New York Times, "using both public and confidential records as well as the results of studies it commissioned," puts together "the most comprehensive estimates to date" on the scale of bitcoin mining in the U.S. and the real-world impact of bitcoin's massive electricity consumption.
"Texas was gasping for electricity. Winter Storm Uri had knocked out power plants across the state, leaving tens of thousands of homes in icy darkness. By the end of Feb. 14, 2021, nearly 40 people had died, some from the freezing cold. Meanwhile, in the husk of a onetime aluminum smelting plant an hour outside of Austin, row upon row of computers were using enough electricity to power about 6,500 homes as they raced to earn Bitcoin, the world’s largest cryptocurrency. ... In Texas, the computers kept running until just after midnight. Then the state’s power grid operator ordered them shut off, under an agreement that allowed it to do so if the system was about to fail. In return, it began paying the Bitcoin company, Bitdeer, an average of $175,000 an hour to keep the computers offline. Over the next four days, Bitdeer would make more than $18 million for not operating, from fees ultimately paid by Texans who had endured the storm. ... Each of the 34 operations The Times identified uses at least 30,000 times as much power as the average U.S. home. ... It is as if another New York City’s worth of residences were now drawing on the nation’s power supply, The Times found. ... In Texas, where 10 of the 34 mines are connected to the state’s grid, the increased demand has caused electric bills for power customers to rise nearly 5 percent, or $1.8 billion per year, according to a simulation performed for The Times by the energy research and consulting firm Wood Mackenzie. ... “Ironically, when people are paying the most for their power, or losing it altogether, the miners are making money selling energy back to Texans at rates 100 times what they paid,” said Ed Hirs, who teaches energy economics at the University of Houston and has been critical of the industry." ... Of course, other industries, including metals and plastics manufacturing, also require large amounts of electricity, causing pollution and raising power prices. But Bitcoin mines bring significantly fewer jobs, often employing only a few dozen people once construction is complete, and spur less local economic development. ... The [Applied Digital bitcoin] mine [in Jamestown, ND] has 33 employees and uses nearly 10 times as much electricity as all the homes in the 16,000-person town. It is one of three mines in the state that together consume nearly as much power as every home in North Dakota." https://www.nytimes.com/2023/04/09/business/bitcoin-mining-electricity-pollution.html Three years after the beginning of COVID shutdowns, the downtown areas of many major U.S. cities remain a shadow of their former selves. One way of measuring downtown life is looking at cellphone activity. This geo-graphic from Statista looks at research comparing cell phone activity in 2019 with that of Fall 2022 in select North American cities. Emptiest cities? San Francisco, Cleveland, and Portland. www.statista.com/chart/29722/cellphone-activity-in-north-american-downtowns (For full results, see downtownrecovery.com/dashboards/recovery_ranking.html.)
U.S. housing prices have shown a highly unusual bifurcated pattern this year: prices in every major metropolitan market west of Dallas (except San Antonio) have fallen while housing prices in every major metropolitan market east of Denver (except Austin) have risen. (Map from www.wsj.com/articles/home-prices-housing-market-trends-east-west-83c9eb56.)
Which are the most (and least) innovative states in 2023, as measured by 22 indicators of innovation friendliness -- from proportion of STEM jobs in the state's economy and entrepreneurialism to R&D spending and scores on 8th grade science and math exams? According to WalletHub, the most innovative states are Massachusetts, Washington, and Maryland. (The least innovative states? Mississippi, Louisiana, and North Dakota.) wallethub.com/edu/most-innovative-states/31890
The AidData lab at the College of William & Mary has found 22 countries that have relied on often-opaque emergency lending from China since 2000, either via liquidity swaps with China's central bank or lines of credit from state-owned Chinese banks. This emergency lending is often at higher interest rates than emergency loans from the IMF, for example, and may not be recorded as external debt, concealing a country's actual debt load. www.statista.com/chart/29603/chinese-emergency-bailouts
The branches of the now-defunct Silicon Valley Bank were highly geographically concentrated -- but perhaps not where one might suppose: one-third of the bank's locations were in the Boston area (a huge biotech hub) and roughly one-quarter were in the Los Angeles metro area. 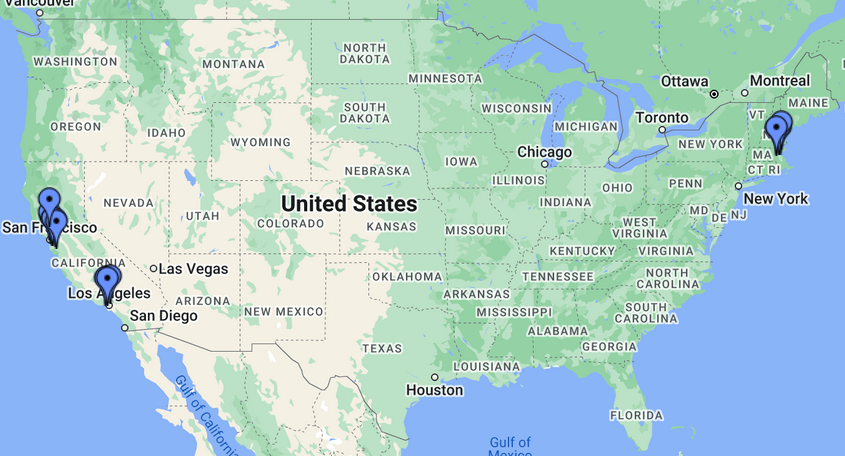 The statistics in this article from The New York Times Magazine are rather stunning, as is its conclusion about the cause of Britain's precipitous decline: "In December, as many as 500 patients per week were dying in Britain because of E.R. waits, according to the Royal College of Emergency Medicine, a figure rivaling (and perhaps surpassing) the death toll from Covid-19. ... By the end of next year, the average British family will be less well off than the average Slovenian one, according to a recent analysis by John Burn-Murdoch at The Financial Times; by the end of this decade, the average British family will have a lower standard of living than the average Polish one." www.nytimes.com/2023/01/25/opinion/uk-economic-decline-nhs.html
This map, based on U.S. Department of Transportation data, shows train derailments over the last 47 years. (Map from www.nytimes.com/2023/02/17/opinion/ohio-train-derailment-safety-regulation.html.)
Over the last two decades, China's economic influence in Africa has grown enormously, as a lender, as a buyer of raw materials, and, as this map shows, as a primary source of imported goods. www.statista.com/chart/26668/main-import-countries-sources-africa
Chicago is hoping to further its ambitions of becoming a tech hub by attracting tech workers laid off by firms in Silicon Valley and elsewhere to the Windy City. Specifically, Chicago is trying to make itself a destination for holders of H-1B visas. H-1B visas, which are reserved for in-demand occupations, require employer sponsorship; when holders of H-1B visas are laid off, they have only 60 days to find a new employer willing to sponsor their visa or they must leave the country. (Roughly 40% of software engineers working in the U.S. were born outside the country.) A consortium of Chicago employers and civic groups is trying to target laid off H-1B visa holders to fill job openings, keep tech talent in the U.S., and promote Chicago as a destination for top tech talent. www.bloomberg.com/news/articles/2023-01-25/chicago-seeks-to-lure-foreign-workers-laid-off-by-tech-giants
As this article from Foreign Policy makes clear, FTX and Sam Bankman-Fried were not based in the Bahamas just because of the pleasant weather. Instead, the Bahamas was chosen for its crypto-friendly regulatory framework, the most recent banking initiative of an island nation that has frequently found ways to take advantage of interstices in the global economy. foreignpolicy.com/2023/01/15/the-hidden-history-of-the-worlds-top-offshore-cryptocurrency-tourist-trap
This geo-graphic from Statista looks at "land grabs" in the developing world, defined as "the buying, leasing or concession land use for commercial purposes by companies from abroad, affecting land that had previously been used communally, by small-scale shareholders or was natural environment." (Until 2019, the country experiencing the most land grabs was Peru, but Peru is not on this list because it has been reclassified as an upper-middle income country.) cdn.statcdn.com/Infographic/images/normal/19044.jpeg
According to an analysis by Good Jobs First, a not-for-profit that tracks agreements between Amazon and state and local governments, Amazon has received more than $5 billion in government subsidies. This data visualization, published in Quartz, shows which states have been most generous to Amazon (from https://qz.com/emails/daily-brief/1849825382/chinese-protests-ripple-effect).
|
Blog sharing news about geography, philosophy, world affairs, and outside-the-box learning
Archives
December 2023
Categories
All
|
 RSS Feed