|
Which states produce the most physicians per capita? According to the Census Bureau, as shown on this map, the District of Columbia, New York, and Utah have produced the most people employed as physicians over the last 10 years. (Map from www.washingtonpost.com/business/2023/08/18/states-most-artists-writers/.)
0 Comments
Crash Map maps fatal car crashes across the contiguous U.S. by state, by county, and by date. In many states, August is among the worst months for fatal car crashes. nextbase.com/crash-map
Although not population adjusted, this map from Statista highlights the U.S. states that make above-average contributions to U.S. GDP and notes a few that punch above their weight (California, Massachusetts, New York) and below their weight (Florida): www.statista.com/chart/9358/us-gdp-by-state-and-region
Last fall, low water levels on the Mississippi River cost the U.S. economy an estimated $20 billion in shipping losses. This spring, the Mississippi rebounded, flooding communities in Iowa and Illinois. But a dry summer is again threatening shipping. This map compares water levels at major ports along the Mississippi with historic averages. (Map from www.wsj.com/articles/mississippi-river-careens-from-floods-to-low-water-threatening-barge-traffic-a6d5758d.)
College football starts in a few weeks. Last week it was announced that in 2024 the Big Ten athletic conference, originally 10 mostly large land-grant universities in the Midwest, will expand to 18 teams, spread from the Atlantic coast to the Pacific coast. This map shows the states in which the original Big Ten teams are located (in red), the states with universities that joined the Big Ten in the last 30 years (in black), and the location of the four new member universities starting next year (in white). 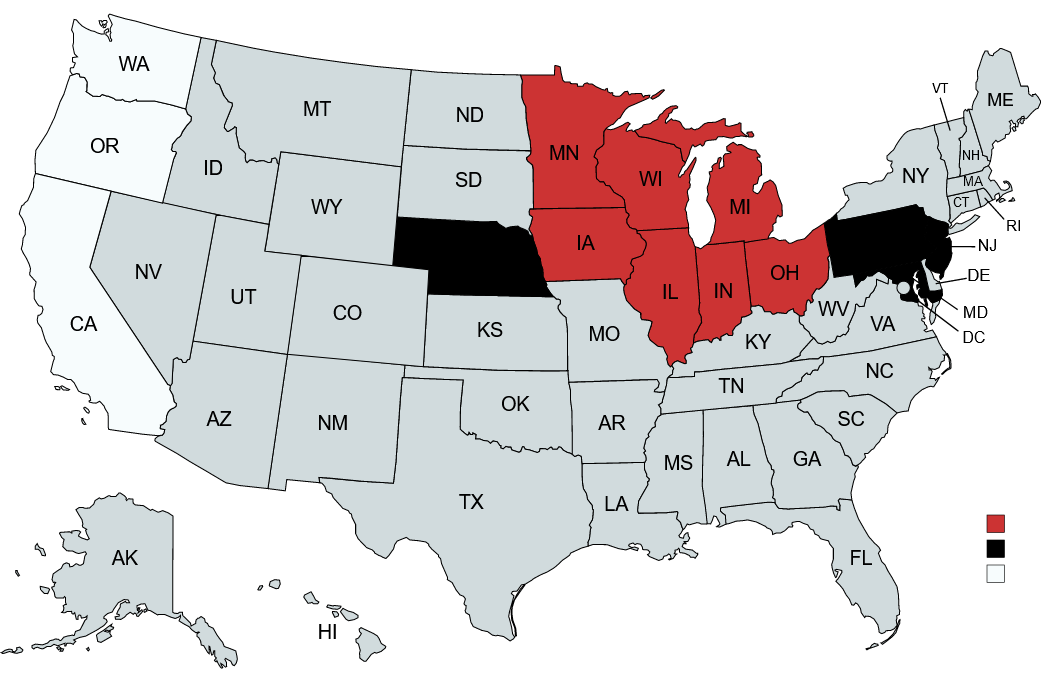 Novelist and UC Riverside professor of creative writing Susan Straight has created a literary map of America, collaborating with ESRI to locate and label the settings of 1,001 novels that celebrate America, from small towns and city neighborhoods to ranches, bayous, deserts, and frozen tundra. To see the selections and their associated places, see storymaps.arcgis.com/collections/997b82273a12417798362d431897e1dc?item=13
Timed for release the same day as the Hollywood movie "Oppenheimer," a new study finds that nuclear radiation from the July 16, 1945 U.S. nuclear test, code named "Trinity," was "much stronger than anticipated. ... [The mushroom] cloud and its fallout went farther than anyone in the Manhattan Project had imagined in 1945. Using state-of-the-art modeling software and recently uncovered historical weather data, the study’s authors say that radioactive fallout from the Trinity test reached 46 states, Canada and Mexico within 10 days of detonation." The timelapse map in this New York Times article shows the likely spread of radiation over the first 10 days following "Trinity": www.nytimes.com/2023/07/20/science/trinity-nuclear-test-atomic-bomb-oppenheimer.html
As extreme heat grips much of the world, Death Valley, CA seems to have set a new record: its midnight temperature was measured at 120°F. The low a few hours later was measured at 105°F, which would also be a record if confirmed. www.newscientist.com/article/2382959-death-valley-may-have-just-had-the-hottest-recorded-midnight-ever/
California is the green-energy state, right? Actually, Texas significantly outperforms California in the production of electricity from wind and solar: i.kinja-img.com/gawker-media/image/upload/73928045cb552a9fba511ccc35840123.png (Geo-graphic from Quartz.)
All 50 U.S. states and all 13 Canadian provinces and territories have an official bird. The maps in this article from the Cornell Lab of Ornithology instead re-imagine the bird of each state and province/territory based on eBird data: which bird is most likely to make the state its primary home? Instead of the Baltimore Oriole, for example, Maryland might want to consider the Seaside Sparrow because more than 13% of the global population of Seaside Sparrows breeds in Maryland. Virginia would trade the Northern Cardinal for the Acadian Flycatcher because, during breeding season, Virginia has a higher density of Acadian Flycatchers than any other state. Louisiana would keep the Brown Pelican because 37% of the world's Brown Pelicans breed in Louisiana. www.allaboutbirds.org/news/a-modest-proposal-can-ebird-help-choose-better-state-birds-part-1/#
A topographic map of California quickly reveals the Central Valley, a broad valley that runs nearly the length of California, from north of Sacramento to south of Bakersfield. Today, that is some of the U.S.'s most productive agricultural land. But historically it has also been a lake, filled to a depth of three feet or more following years with abundant rain or snowfall, like this year. In the southern basin of the Central Valley was Tulare Lake, once the biggest body of freshwater west of the Mississippi River. With snow melting in the mountains this spring, Tulare Lake has reemerged, with more than 150 square miles of lake bed refilling to submerge farms, roads, homes, electrical transformers, and anything else that might have been there: www.nytimes.com/2023/06/25/us/california-storms-tulare-lake.html.
Have peach prices been higher in your grocery store this spring? Even though California and South Carolina grow most of the country's peaches, this year's supply has been dented by the failure of Georgia's peach crop: at least 90% of the Peach State's crop was done in by early blooming followed by a cold snap, resulting in the first loss of Georgia's peach crop since 1955. A handful of orchards in the center of the state account for 95% of Georgia's peaches and usually send about 150 million peaches to grocery stores. www.economist.com/united-states/2023/06/08/georgia-the-peach-state-has-no-peach-crop-this-year
According to the latest Census data released last week, Black Americans are continuing to move out of urban areas in the North, Midwest, and West, some departing for nearby suburbs and some for urban areas in the South. (Map from www.wsj.com/articles/black-americans-are-leaving-cities-in-the-north-and-west-c05bb118.)
The U.S. "electricity grid" is not a single entity: as this map shows, the bulk of the national grid is actually three almost entirely unconnected regional grids operated by a patchwork of different operators. The maps in this article from the New York Times illustrate the fragmentation of the U.S. electricity grid. (Map from www.nytimes.com/interactive/2023/06/12/climate/us-electric-grid-energy-transition.html)
Last week's smoky air has dissipated on the East Coast, but this is almost certainly not the last time you will find yourself wondering about air quality. The Environmental Protection Agency's AirNow map shows air-quality data, updated hourly: gispub.epa.gov/airnow/?monitors=pm (You can select for ozone, particulate matter, or both.)
The headlines associated with the first geo-graphic in this article tend to focus on hot job creation rates in politically "red" vs. "blue" states. This analysis, though, goes deeper into the hiring numbers to discuss connections with job churn, wages, education, and housing: www.washingtonpost.com/business/2023/05/26/hiring-red-blue-states/
Farmers in my native upper Midwest should have their fields mostly planted by now. This map shows the percentage of each state's land area taken up by corn fields (nearly all of which is field corn, or cattle or cow corn, not sweet corn): cerealsecrets.com/corn-fields-usa/
Planning a road trip or local getaway? This article highlights what editors consider to be the best state parks in the U.S. (The eagle-eyed among you might recognize a few of the photos on my website were taken at some of the state parks profiled.) www.outsideonline.com/adventure-travel/national-parks/best-state-parks-in-us
It's well known that bitcoin mining uses an enormous amount of electricity, but what does that look like on the ground? In this article, The New York Times, "using both public and confidential records as well as the results of studies it commissioned," puts together "the most comprehensive estimates to date" on the scale of bitcoin mining in the U.S. and the real-world impact of bitcoin's massive electricity consumption.
"Texas was gasping for electricity. Winter Storm Uri had knocked out power plants across the state, leaving tens of thousands of homes in icy darkness. By the end of Feb. 14, 2021, nearly 40 people had died, some from the freezing cold. Meanwhile, in the husk of a onetime aluminum smelting plant an hour outside of Austin, row upon row of computers were using enough electricity to power about 6,500 homes as they raced to earn Bitcoin, the world’s largest cryptocurrency. ... In Texas, the computers kept running until just after midnight. Then the state’s power grid operator ordered them shut off, under an agreement that allowed it to do so if the system was about to fail. In return, it began paying the Bitcoin company, Bitdeer, an average of $175,000 an hour to keep the computers offline. Over the next four days, Bitdeer would make more than $18 million for not operating, from fees ultimately paid by Texans who had endured the storm. ... Each of the 34 operations The Times identified uses at least 30,000 times as much power as the average U.S. home. ... It is as if another New York City’s worth of residences were now drawing on the nation’s power supply, The Times found. ... In Texas, where 10 of the 34 mines are connected to the state’s grid, the increased demand has caused electric bills for power customers to rise nearly 5 percent, or $1.8 billion per year, according to a simulation performed for The Times by the energy research and consulting firm Wood Mackenzie. ... “Ironically, when people are paying the most for their power, or losing it altogether, the miners are making money selling energy back to Texans at rates 100 times what they paid,” said Ed Hirs, who teaches energy economics at the University of Houston and has been critical of the industry." ... Of course, other industries, including metals and plastics manufacturing, also require large amounts of electricity, causing pollution and raising power prices. But Bitcoin mines bring significantly fewer jobs, often employing only a few dozen people once construction is complete, and spur less local economic development. ... The [Applied Digital bitcoin] mine [in Jamestown, ND] has 33 employees and uses nearly 10 times as much electricity as all the homes in the 16,000-person town. It is one of three mines in the state that together consume nearly as much power as every home in North Dakota." https://www.nytimes.com/2023/04/09/business/bitcoin-mining-electricity-pollution.html For a better appreciation of U.S. topography (and the challenges of westward expansion), check out this computer-generated map of the contiguous U.S.: www.reddit.com/r/dataisbeautiful/comments/jslbn9/us_elevation_tiles_oc/
This article from Politico analyzes the geography of gun-related deaths in the context of U.S. cultural geography. "The geography of gun violence — and public and elite ideas about how it should be addressed — is the result of differences at once regional, cultural and historical. Once you understand how the country was colonized — and by whom — a number of insights into the problem are revealed. ... The reason the U.S. has strong regional differences is because our swath of the North American continent was settled by rival colonial projects that had very little in common, often despised one another and spread without regard for today’s state boundaries. ... As expected, the disparities between the regions are stark, but even I was shocked at just how wide the differences were and also by some unexpected revelations." www.politico.com/news/magazine/2023/04/23/surprising-geography-of-gun-violence-00092413
Three years after the beginning of COVID shutdowns, the downtown areas of many major U.S. cities remain a shadow of their former selves. One way of measuring downtown life is looking at cellphone activity. This geo-graphic from Statista looks at research comparing cell phone activity in 2019 with that of Fall 2022 in select North American cities. Emptiest cities? San Francisco, Cleveland, and Portland. www.statista.com/chart/29722/cellphone-activity-in-north-american-downtowns (For full results, see downtownrecovery.com/dashboards/recovery_ranking.html.)
Winter showers bring spring flowers. For those planning a field trip to southern California or Arizona soon, this article provides details on when and where to see the desert wildflowers that are expected to be blooming in abundance after the region's wet winter: www.nytimes.com/2023/04/01/travel/california-arizona-spring-wildflowers.html
California has had an enormous amount of rain and snow this winter, but Florida is experiencing a worsening drought, raising concerns about reduced agricultural output and wildfires in Florida this year. "About two-thirds of Florida is under moderate to extreme drought conditions, mainly in the central and southern parts of the state, according to the most recent weekly report by the U.S. Drought Monitor, a joint effort of academic and government institutions. ... Officials are particularly concerned about an area in southwestern Florida where Hurricane Ian struck last year and left heaps of forest debris on the ground that could fuel wildfires. Much of that area is now experiencing among the most intense drought conditions in the state." www.wsj.com/articles/deepening-florida-drought-hits-ranchers-growers-d4e9abb1
U.S. housing prices have shown a highly unusual bifurcated pattern this year: prices in every major metropolitan market west of Dallas (except San Antonio) have fallen while housing prices in every major metropolitan market east of Denver (except Austin) have risen. (Map from www.wsj.com/articles/home-prices-housing-market-trends-east-west-83c9eb56.)
|
Blog sharing news about geography, philosophy, world affairs, and outside-the-box learning
Archives
December 2023
Categories
All
|
 RSS Feed