|
Reader's Digest magazine ran a statistically unreliable but nevertheless fun experiment: 12 wallets were "dropped" in each of 16 cities around the world. Each wallet contained a family photo, a name with cell phone number, business cards, and the equivalent of $50 in local currency. The wallets were "dropped" on sidewalks, in parks, and near shopping malls. This map shows what fraction of the 12 wallets were returned in each of the test cities: https://www.earthlymission.com/wp-content/uploads/2017/07/TheLostWalletExperiment.jpg
0 Comments
U.S. farmers have always changed their crops to suit markets and climate. This article looks at the shifts currently underway. "Geography isn’t static. Rivers change course, mountains erode, and islands disappear under rising seas. The geography of farming and food changes, too. For example, 180 years ago my home county was the castor bean and castor oil capital of the U.S. Both titles, however, slipped into irrelevance as a new resource, crude oil, rose to dominate the lubricant business. Today, fewer and fewer Americans have ever heard of castor beans or castor oil. Those long-forgotten twins seem to have a modern equivalent. Total U.S. wheat acres peaked at 88 million in 1981. Last year, the most recently completed reporting year, total U.S. wheat acres were about half of that, or 45.6 million acres. ... It’s no surprise that the two biggest benefactors of wheat’s decline are America’s two biggest crops, corn and soybeans. ... There are two critical (among other) reasons for the big switch: Government ethanol blending mandates have fueled corn’s rise and fast-growing soy exports, especially to China, have pushed soybean acres higher. Both forces, however, are losing steam. Increased use of electric cars and, soon, trucks, already has flat-lined the once-voracious U.S. gasoline — and, in turn, ethanol — appetite and continued global competition in the soy trade is pinching U.S. soybean margins toward break-even."
www.telegraphherald.com/news/agriculture/article_a0e4379b-2c3b-590c-8ae1-416b03271c22.html According to the U.S. Geological Survey, there are nearly 1500 volcanoes around the world believed to be active, of which more than half are located in the six countries shown in red on this map. The U.S. has 169 "potentially active" volcanoes, the majority of which are in Alaska. Hawaii has five volcanoes that have erupted in the last 250 years: Kilauea (erupted nearly continuously from 1983 to 2018), Mauna Loa (last erupted in 1984 but believed to be poised to erupt again soon), Loihi (last erupted 1996), Hualalai (last erupted 1801), and Haleakala (last erupted about 1790). Haleakala is on Maui; all of the rest are on the island of Hawaii. 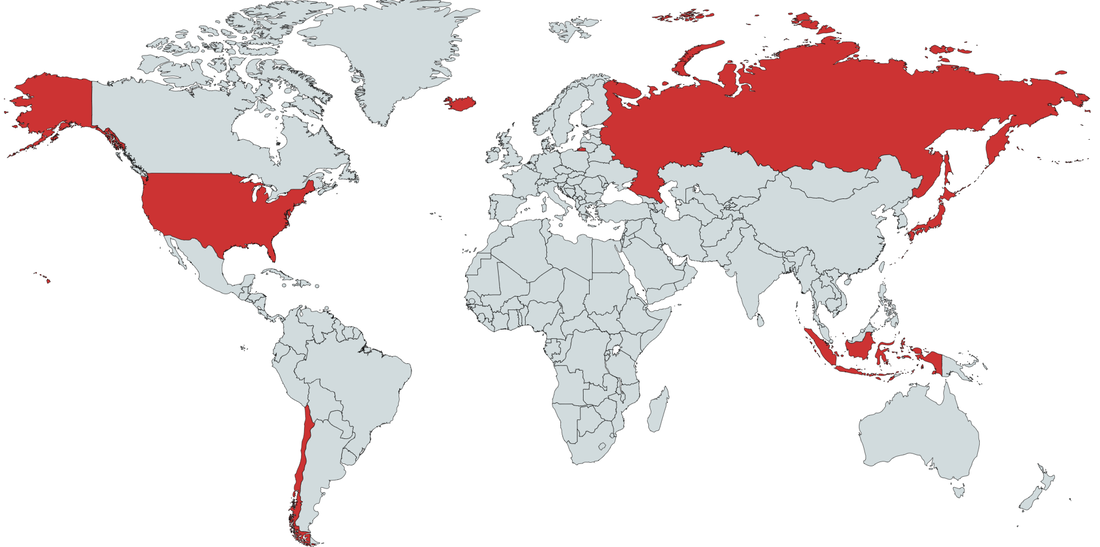 Scientists recently discovered a new biological community living in the world's driest nonpolar desert: a novel collection of lichens, fungi, algae and cyanobacteria has been found "gluing" together tiny pebbles on the surface of Chile's Atacama Desert. The resulting microbial community is believed to subsist on the fog that rolls in regularly from the Pacific; the weathering of these tiny rocks by fungal acids is believed to be the only source of soil creation in the Atacama. Globally, biocrusts, or topical soil communities comprised of algae, cyanobacteria, lichens, fungi or mosses, "cover an estimated 12 percent of the land on Earth" and are particularly prevalent in deserts. www.sciencenews.org/article/new-atacama-desert-soil-fungi-lichen-community-survives-fog-sips
Donkey hides are used in a traditional Chinese medicine called ejiao. Demand for ejiao is leading to donkey-napping (stealing a farmer's donkey and selling the donkey or its hide) in countries like Kenya and the decimation of donkey populations, with roughly 4.8 million donkeys per year being used in ejiao production. A recent report released by a donkey conservation group estimates that half the world's donkey population will be gone within 5 years at this rate. This geo-graphic looks at countries that have already experienced significant declines in donkey population: www.statista.com/chart/20049/change-in-donkey-population-in-selected-countries/
With Saudi Arabia's state-owned oil company, Saudi Aramco, heading for an initial public offering (IPO) it seemed timely to share this set of maps from Visual Capitalist, detailing the world's biggest oil discoveries since 1868. www.visualcapitalist.com/map-worlds-biggest-oil-discoveries-since-1868/
Assembling data from nearly 7000 sites around the world, researchers have assembled the first map of global earthworm distribution. "During the 1800s, intrepid explorers collected and cataloged many of the world’s plants and animals, providing range maps for different species that launched further study. But that wasn’t true for subterranean life. ... [E]arthworms have been studied long enough in Europe that most of the species are known. (The United Kingdom has 33 kinds.) But in the tropics, 'Every time they dig a hole, they find a new species of earthworm,' [soil ecologist Helen] Phillips says. ... [Researchers] were surprised when their analysis showed that temperature and rainfall seem to have a greater influence on where earthworms do best than soil type, they report today in Science. ... The effects of temperature and rainfall suggest climate change will have a far greater influence on below-ground life than expected, they say. Consequently, life above ground might also be affected in ways not previously anticipated. The distribution of different earthworm species was also surprising. When it comes to life above ground, the tropics have the greatest biodiversity. But underground, these constantly warm regions are far less diverse, at least at a local scale: The rich soils of Europe, the northeastern United States, the southern tip of South America, and the southern regions of New Zealand and Australia seem to have more earthworm species in a given area. Those temperate zones also host more earthworms overall, according to the model, with up to 150 per square meter versus just five per square meter in the tropics." www.sciencemag.org/news/2019/10/first-global-map-earthworms-reveals-which-places-are-chock-full-them-and-why
Recent protests and elections in Chile and Argentina, respectively -- countries generally considered among South America's wealthiest -- have highlighted a high level of public dissatisfaction. This map, from The Economist (UK) and based on 2018 data, looks at the proportion of adults across Latin America who agree that they want to leave their country. Not surprisingly, countries like Venezuela (hyperinflation), Honduras and El Salvador (violence), and Haiti (poverty) rank highly, but nearly 1/3 of adults across the region want to emigrate. www.economist.com/graphic-detail/2019/09/07/nearly-a-third-of-latin-americans-want-to-emigrate
The recent fires in the Amazon rainforest, which is sometimes nicknamed the world's lungs because of its oversized role in global oxygen production, has given more attention to the idea that ecocide, like genocide, should be listed as a crime against humanity and prosecuted as such. This article from The New York Times looks at the history of the ecocide movement.
"There is no international crime today that can be used to neatly hold world leaders or corporate chief executives criminally responsible in peacetime for ecological catastrophes that result in the type of mass displacements and population wipeouts more commonly associated with war crimes. But environmentalists say the world should treat ecocide as a crime against humanity — like genocide — now that the imminent and long-term threats posed by a warming planet are coming into sharper focus. ... The first prominent call to outlaw ecocide was made in 1972 by Prime Minister Olof Palme of Sweden, who hosted the United Nations’ first major summit on the environment. In his keynote address at the conference, Mr. Palme argued that the world urgently needed a unified approach to safeguard the environment. “The air we breathe is not the property of any one nation, we share it,” he said. “The big oceans are not divided by national frontiers; they are our common property.” ... During the 1980s and 1990s, diplomats considered including ecocide as a grave crime as they debated the authorities of the International Criminal Court, which was primarily established to prosecute war crimes. But when the court’s founding document, known as the Rome Statute, went into force in 2002, language that would have criminalized large-scale environmental destruction had been stripped out at the insistence of major oil producing nations. ... "Facing a cascade of international pressure and a boycott of some Brazilian exports, [Brazilian president Jair] Bolsonaro last month ordered a military operation to put out fires in the Amazon. But the government’s overriding message has been that the world’s angst about the Amazon is an unwelcome and unwarranted intrusion on Brazil’s sovereignty. ... "In the best of cases, campaigners to outlaw ecocide say it would take a few years to muster the support they need to amend Rome Statute. But merely raising the profile of the debate over penalizing ecocide could go a long way toward shaping the risk assessment of corporations and world leaders who until now have regarded environmental disasters mainly as public relations nightmares." www.nytimes.com/2019/09/21/sunday-review/bolsonaro-amazon-fire.html This GIF from the National Audubon Society and the Cornell Lab of Ornithology shows annual bird migrations in the Western Hemisphere. (These maps are based on bird observations from 2002 to 2014 and do not necessarily reflect the recent data finding that North America has lost nearly 30% of its bird population since 1970.) www.audubon.org/news/see-millions-places-migrating-birds-have-gone-one-gif
The U.S. recently marked the 400th anniversary of the arrival of the first ship of enslaved people from Africa to U.S. shores. Yet, as my "Your Future World" students are always surprised to learn when we study Brazil, the U.S. accounted for only about 3% of the Transatlantic slave trade, with Brazil accounting for about 40% and the Caribbean accounting for another 40-45%. This map shows both destinations and origins of enslaved people, some of whom were from coastal communities in western Africa while others were captured in interior regions and sold to slavers at the coast. www.statista.com/chart/19068/trans-atlantic-slave-trade-by-country-region/
Brazil has experienced 80% more wildfires thus far in 2019 than in the same period in 2018, and the traditional wildfire season is just beginning. Global Forest Watch collates NASA satellite data to create near-real time maps of fires around the world. This map shows the location of fire alerts from a recent week. (Although fires in Brazil have gotten all the press, the Global Forest Watch map also shows extensive forest fires across central Africa.) fires.globalforestwatch.org/map 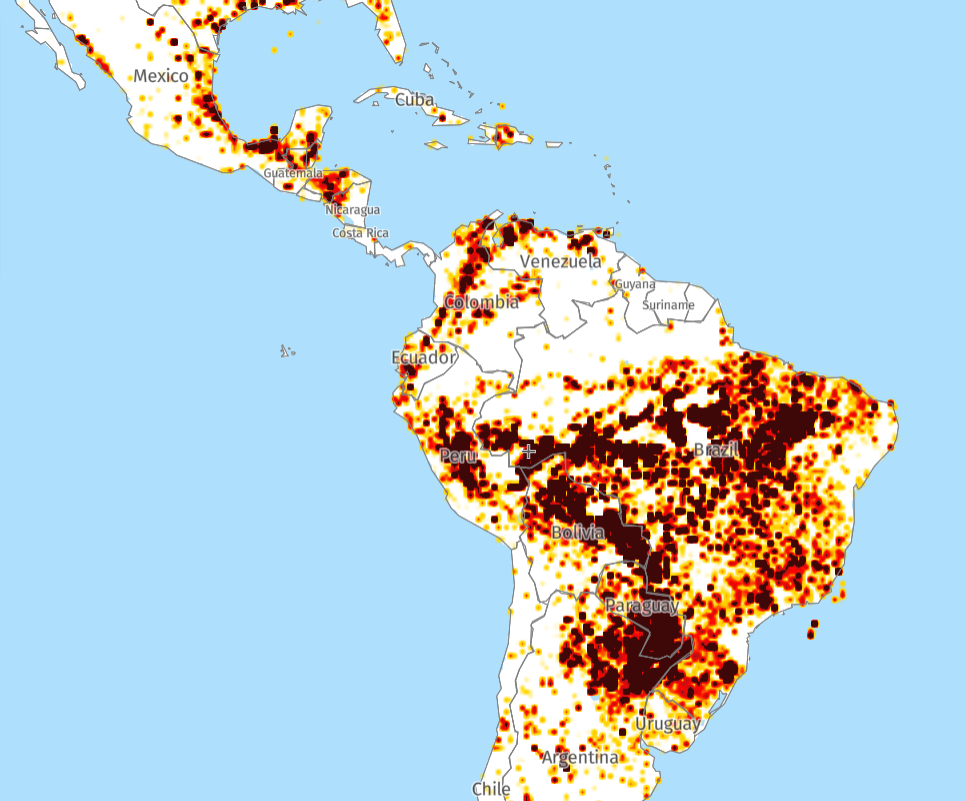 This geo-graphic compares health care expenditures to life expectancy for 32 countries in the Americas: howmuch.net/articles/the-state-of-worlds-health
Much of the eastern and central U.S. has been struggling through an excessively wet spring, to the point that many farmers still have not been able to plant their crops. It is easy to forget that this experience is not the norm, though. This map looks at precipitation patterns globally over the last two years. The areas in dark red -- which include most of Australia and Western Europe, much of northern South America, parts of India, Canada, and the western U.S., and much of southern Africa, the Sahel, and the Horn of Africa -- have experienced significantly below-average precipitation through the two years ending in May. You can play with the parameters of the data to see where drought is evident or imminent: spei.csic.es/map/maps.html 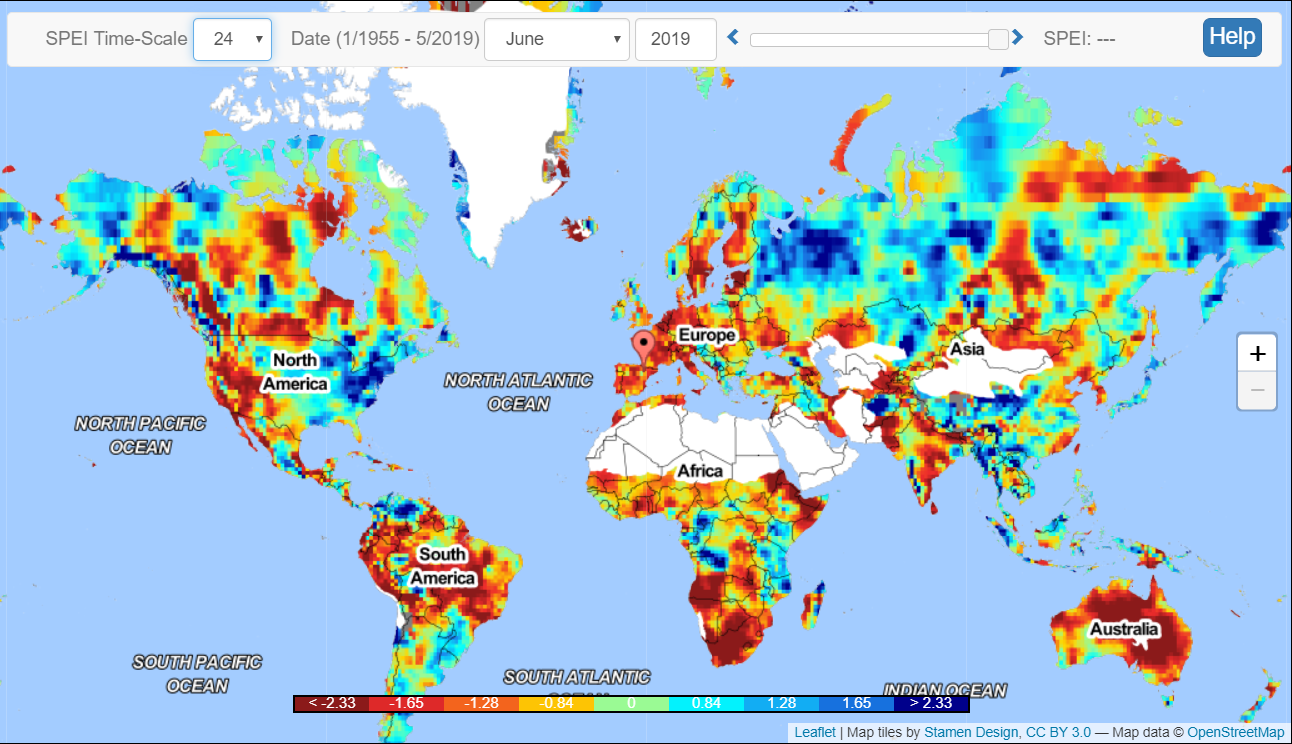 In January, a tailings dam associated with an iron mine in Brazil collapsed. The resulting flood of mining waste killed more than 200 people. There are an estimated 3,500 tailings dams worldwide, with 42 dam failures recorded between 2008 and 2017. This map shows the countries with the most tailings dam failures in recent history and the amounts of mine waste released: geographical.co.uk/places/mapping/item/3145-tailings-dam-cartograms
A cartogram is map that has been weighted for a particular variable. In this case, the variable is either the population of domesticated sheep (in green) or cattle (in red). Not only do these maps and cartograms reveal important geographic differences in sheep and cattle production -- reflecting both cultural preferences and physical geography -- they also highlight areas that are amenable to neither, including the dead zone in central Africa due to the tsetse fly. geographical.co.uk/images/articles/places/mapping/2019/Cattle_and_sheep/Webcartogram.jpg
Many people think South America is a sea of Spanish with the exception of Portuguese-speaking Brazil. This map paints a more complex picture, with English (Guyana), Dutch (Suriname), and French (French Guiana) along the northeast coast and significant pockets of indigenous languages. sblanguagemaps.files.wordpress.com/2012/11/samerica11.png
Hyperinflation and economic collapse in Venezuela have led to increases in violence, malnutrition, and disease as well as the exodus of more than 3 million Venezuelans since 2014. The Center for Strategic & International Studies estimates that throughout 2018 an average of 3,000 people per day were crossing from Venezuela into Colombia alone. This map looks at where most Venezuelans migrants have gone. ichef.bbci.co.uk/news/624/cpsprodpb/CDBC/production/_103886625_venezuela_map_migration_destinations_640-nc.png
The World Bank has announced that extreme poverty (defined as living on income of less than $1.90 per day) has fallen to a record low 10% of global population. These maps look at extreme poverty rates globally and by continent. howmuch.net/articles/people-living-in-extreme-poverty-2018
This interactive mapping site allows you to enter any location in North America, Australia, or New Zealand, as well as parts of South America and Greenland, to find out which indigenous people(s) used to live where you do now. native-land.ca/
The trade-offs between economic growth and environmental protection are not new. In the case of Chile, the country's economy has long been dependent on mining, traditionally copper but more recently lithium. Chile stands to benefit from soaring global demand for lithium -- the country is home to more than 50% of the world's known reserves of lithium -- but most of Chile's lithium is suspended in water under the Atacama Desert, one of the world's driest places. This article looks at the "water wars" developing in Chile as mining companies compete with indigenous populations for water rights. www.reuters.com/article/us-chile-lithium-water/in-chilean-desert-global-thirst-for-lithium-is-fueling-a-water-war-idUSKCN1LE16T
The Human Development Index (HDI) ranks countries based on education, life expectancy, and per-capita income. This map -- which is based on 2015 data and, therefore, does not consider the hyperinflation that has devastated Venezuela's economy -- looks at the HDI of South American countries by state/province. The region with the highest HDI in South America: Santiago Province, Chile. www.reddit.com/r/MapPorn/comments/95xxgz/subnational_entities_of_south_america_by_human/
This topological cartogram, based on data from the World Trade Organization, shows the countries of the world by the value of their exports. (This graphic does not include those countries that do not export at least $20 billion worth of goods, explaining the absence of parts of South America and most of Africa, among others.) howmuch.net/articles/largest-exporting-countries-2017
One of the more provocative ideas for new governance models has been the seasteading movement, which seeks to create permanent dwellings in international waters (i.e., outside the purview of any existing nation-states). As this article on the Galápagos Islands points out, though, providing food for an island population has distinct challenges. geographical.co.uk/people/development/item/2772-feeding-the-galapagos
Each area represented on this map of Brazil -- white, blue, yellow, and green -- contains roughly the same number of people (about 52 million). www.facebook.com/geografianews/photos/a.1382906095271627.1073741827.1382790848616485/2203809069847988/?type=3&theater
|
Blog sharing news about geography, philosophy, world affairs, and outside-the-box learning
Archives
December 2023
Categories
All
|
 RSS Feed