|
Chad's capital of N'Djamena sits at the confluence of the two major rivers that feed Lake Chad, to the north of the capital. A rainy season that came early and has produced unusually heavy rains, after years of drought, resulted in massive flooding in N'Djamena over the weekend, with many streets in the capital navigable only by boat. www.nationsonline.org/maps/Chad-political-map.jpg
0 Comments
Fog is a vital characteristic of biomes ranging from temperate rainforests to cloud forests and may even become a source of water commercially harvested for drinking. Yet scientists around the world are finding that fog, particularly along the coasts, seems to be in decline for complex reasons, including warming oceans. "Fog may be the most difficult meteorological phenomenon to capture, calculate and predict. Unlike temperature, precipitation, humidity or wind, there is no reliable gauge for it. There is not even a practical definition of it. Most will say that fog is a cloud that touches the ground, which sounds simple enough. But fog is movement in three dimensions, dipping and rising, forming and disappearing. Sometimes a thin layer hugs the water below the Golden Gate Bridge, blinding mariners. Sometimes it settles about 200 feet higher, blinding drivers. Sometimes it shrouds the top of the bridge’s towers and the airspace above, blinding pilots. Sometimes it does it all. Which of those things is fog? ... Fog from the ocean is a dependable feature in several places around the globe, mostly on the west coasts of major continents. Villages in places like Peru and Chile, sometimes with almost no rain throughout the year, have for centuries sustained themselves largely on fog water. ... Using observational data at airports in the coastal redwood region — from central California to its northern border, including the Bay Area — they found that the frequency of fog, measured by fog hours per day, had dropped 33 percent since the middle of the 20th century." www.nytimes.com/interactive/2022/09/14/climate/san-francisco-fog.html
The second major named storm of the Atlantic hurricane season has just made its way across Cuba and Florida. This map, based on the INFORM Risk Index, looks at the risk of hurricane-related humanitarian crises in Latin America and the Caribbean: cdn.statcdn.com/Infographic/images/normal/28317.jpeg
Using data from a recent study published in Nature, this map from VisualCapitalist shows country-by-country population vulnerability to 1-in-100-year coastal and inland flooding events: www.visualcapitalist.com/countries-highest-flood-risk/
Persistent drought has exacerbated wildfire damage in the American Southwest, but more housing continues to be built in areas vulnerable to wildfires. The maps in this article from The New York Times compare housing developments in 1990 and 2020 in the areas around Sacramento, CA, Denver, CO, and San Antonio/Austin, TX. www.nytimes.com/interactive/2022/09/09/climate/growing-wildfire-risk-homes.html
Americans often confuse the terms "monsoon" and "typhoon." A monsoon is an annual rainy season; it is usually critical for life in the region. A typhoon is a wind storm, like a hurricane, in the Pacific Ocean. The extreme flooding in the news in Pakistan is being caused by monsoon rains. Agriculture would be all but impossible in Pakistan without monsoon rains, but, unfortunately, this year's arrived earlier than normal and are falling more heavily than normal. As of the last official U.N. count, nearly half a million homes in Pakistan have been damaged by the recent flooding and more than 1,000 people have died. This map, from the U.N., shows the damage is concentrated along the lower reaches of the Indus River. By the way, despite was you might read elsewhere, Pakistan cannot experience a typhoon: hurricane-like wind storms in the Indian Ocean are cyclones. (Map from reliefweb.int/report/pakistan/pakistan-2022-monsoon-floods-situation-report-no-03-26-august-2022.)
This has been China's hottest, driest summer since record keeping began 61 years ago, and the impact on the Yangtze River has been severe, with tributaries dried up and water flow in the main branch running 50% below normal. The Yangtze is the longest river in the world that runs through only one country, and five of China's megacities -- cities with a population of at least 10 million -- are in the Yangtze River basin. The Yangtze is not only a key source of water for drinking and irrigation, it is also a major source of hydroelectric power. In Sichuan Province, which gets 80% of its electricity from hydropower, factories have been shut recently to save power for home air conditioning. The next few days may also determine the impact on China's main rice crop. www.euronews.com/2022/08/21/china-declares-first-ever-drought-emergency-amid-intense-heatwave
With drought impacting many of the major river systems of the Northern Hemisphere this summer, this map from Statista looks at hydropower as a percentage of each country's electrical supply: www.statista.com/chart/28032/share-of-electricity-generated-through-hydropower-per-country
California's Central Valley is one of the world's most productive agricultural regions. But it is also periodically, at least measured in geologic time, a long, thin lake. Massive flooding inundates the Central Valley when moisture-rich atmospheric rivers, like the Pineapple Express, stall over California, dumping rain and melting snow in the Sierras. Recent research shows this happens, on average, every 100-200 years. Because this happened most recently between Dec. 1861 and Jan. 1862, scientists are increasingly concerned that the region is ripe for a megaflood event. www.washingtonpost.com/climate-environment/2022/08/12/megaflood-california-flood-rain-climate/
This geo-graphic from Visual Capitalist shows oil production, by country, as of 2021: elements.visualcapitalist.com/largest-oil-producers/
The fight for eastern Ukraine is not just about land or population or territorial integrity. It is also about Ukraine's mineral wealth, a disproportionate share of which lies east of the Dnieper River, as these maps show. (Maps from www.washingtonpost.com/world/2022/08/10/ukraine-russia-energy-mineral-wealth/.)
According to the National Oceanic and Atmospheric Administration (NOAA), this year high-tide or "sunny day" flooding -- when water floods streets and bubbles up through storm drains without storm activity -- on the East Coast of the U.S. is expected to show an increase of more than 150% since 2000. NOAA's calculations are based on data from a network of water-level stations along the U.S. coasts and Great Lakes. This interactive mapping site shows past, present, and anticipated 2050 sunny day flooding levels. (In Washington, DC, for example, the average number of high-tide flooding events in 2000 was three; in 2021, it was five, and by 2050, it is forecast to be 55-85.) tidesandcurrents.noaa.gov/HighTideFlooding_AnnualOutlook.html
Liquifying natural gas is a more expensive, energy-intense alternative to pipelines in the delivery of natural gas. Several European countries are trying to bring more liquified natural gas (LNG) capacity online as quickly as possible to replace Russian, pipeline-delivered gas. This geo-graphic from Statista looks at which countries are currently the biggest suppliers of LNG: www.statista.com/chart/27839/biggest-liquefied-natural-gas-exporters
Soil composition is a vital but often-neglected component of physical and biogeography. Like the American Midwest, Ukraine and southern Russia have some of the world's most productive soil, called chernozem (in Eurasia and Canada) or mollisol (in the U.S). This article from Science News looks at ways in which war has a lasting impact on the underlying soil chemistry, hydrology, structure, and physical composition: www.sciencenews.org/article/ukraine-russia-war-soil-agriculture-crops. (For a map that shows soil types around the world, check out this one from the USDA: https://www.nrcs.usda.gov/wps/portal/nrcs/detail/soils/use/?cid=nrcs142p2_054013.)
Half way between Tasmania and Antarctica lies one of the only spots in the world where the earth's mantle is actually above sea level. Macquarie Island, considered part of Australia, was created by a collision of two tectonic plates that pushed rock that had been kilometers beneath the seafloor above water. Because of its unique geology, Macquarie Island is a designated UNESCO World Heritage Site. www.atlasobscura.com/places/macquarie-island
Earth Day is next week. This map shows (in green) the parts of the world's terrestrial surface least impacted by humans. The darker the green, the less human activity in that region. www.nationalgeographic.com/science/article/where-people-arent
World Water Day was earlier this week. This map, developed by The Economist Intelligence Unit based on projections from the World Resources Institute, shows anticipated stresses on world water supplies by 2040. The UN defines a territory as water stressed when it has withdrawn 25% of its freshwater resources. The EIU report includes a number of other interesting maps related to too much or too little water around the world. (Map from impact.economist.com/sustainability/project/water-optimisation/download/water-opt-report-EIU-version.pdf.)
Climate Central is a US-based nonprofit using science, big data, and proprietary machine-learning mapping to identify coastal areas likely to be underwater or subject to frequent flooding by 2050. According to Climate Central's interactive map, hard-hit areas in Ireland are likely to be Dublin's waterfront and sections of southwestern Ireland, including Shannon's airport and parts of Limerick and County Clare. coastal.climatecentral.org/ 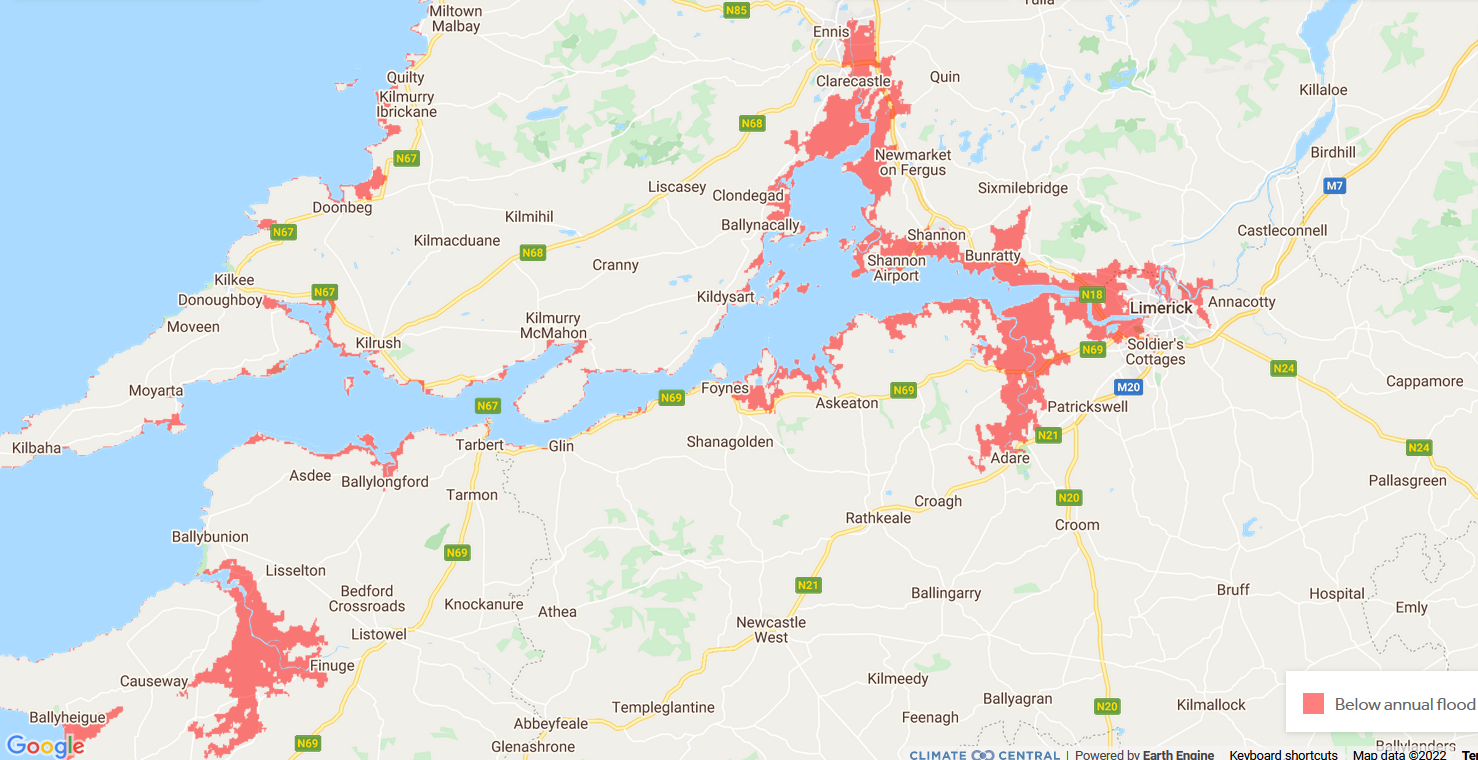 As the world looks for oil and gas options to replace Russia's, Africa's petroleum-producing capacity comes to the fore. This map from Statista shows the continent's major oil-producing countries: cdn.statcdn.com/Infographic/images/normal/26878.jpeg (Algeria, Egypt, Nigeria, and Libya are also significant producers of natural gas.)
The Armed Conflict Location and Event Data Project (ACLED) tracks armed conflicts around the world (adding the terrain is a nice feature): acleddata.com/dashboard/#/dashboard
Students in my geography classes learn about the Cascadian subduction zone and why it's considered a major threat to U.S. security. The maps in this article illustrate the reach of a tsunami triggered by a 9.0 earthquake in the Cascadian subduction zone -- an event scientists consider a one-in-nine probability in the next 50 years -- in a handful of communities in the Pacific Northwest. A major earthquake in the Cascadian subduction zone would likely kill tens of thousands along the coasts of Washington, Oregon, and northern California. www.nytimes.com/2022/02/07/us/tsunami-northwest-evacuation-towers.html
California may be spurring a new gold rush. But this time it's "white gold" -- lithium, the "gold" of the digital age, used in powering everything from electric cars to laptops to smartphones -- and the destination is southern California's Salton Sea. "The geothermal reservoir under the Salton Sea area is capable of producing 600,000 metric tons a year of lithium carbonate, according to estimates from the California Energy Commission. That level of output would surpass last year’s global production." This article from The Wall Street Journal looks at the potential -- and challenges -- for commercial lithium production from the saline Salton Sea. www.wsj.com/articles/where-is-there-more-lithium-to-power-cars-and-phones-beneath-a-california-lake-11644037217
It has been widely reported that last month's volcanic eruption in Tonga was one of the biggest in decades. To better appreciate the size of the ash plume generated by the eruption, this article from Reuters shows the ash plume, as caught on satellite, and superimposes it on a series of maps of more familiar places, from the UK to Florida to the Horn of Africa. 👀 graphics.reuters.com/TONGA-VOLCANO/lgpdwjyqbvo/index.html
Earthquakes caused by fracking have pushed Texas regulators to change some of the rules governing fracking in the Permian Basin of west Texas. In 2021, there were 176 earthquakes in west Texas with a magnitude of 3.0 or more. (In 2019, by comparison, there were 9 earthquakes in the same area.) This map shows the geographic distribution of 2021's earthquakes. (Map from www.wsj.com/articles/texas-earthquakes-prompt-new-fracking-rules-11642424582.)
Indonesia is officially moving its capital from Jakarta: earlier this week the Indonesian legislature authorized building a new capital, Nusantara, on the island of Borneo. This map from Statista looks at other national capitals that have moved (and why): cdn.statcdn.com/Infographic/images/normal/25119.jpeg
|
Blog sharing news about geography, philosophy, world affairs, and outside-the-box learning
Archives
December 2023
Categories
All
|
 RSS Feed