|
China's recent unmanned landing of a craft on the far side of the moon has reignited discussion of all things lunar. This geo-graphic compares the surface area of the moon to the territory of the world's biggest empires -- and finds the moon to be only slightly larger than the British Empire in 1920. (Relative sizes of other empires, including the Mongol, Russian, Spanish, Abbasid, etc. are listed in the linked article.) brilliantmaps.com/british-empire-moon/#more-3949
0 Comments
Global population is expected to grow another 2+ billion by 2050, and the world's cities are expected to absorb all of that future growth. This 79-question multiple-choice quiz invites users to identify a sampling of world cities by location. (Unless it's been fixed, Question 48 is wrong, though.) Want to learn more? Look up the cities that are the incorrect choices.
offbeat.topix.com/quiz/18524/qidx48 Which is the best country in the world for doing business? According to this ranking, it is New Zealand (again), followed by Singapore and Denmark. This map highlights the top 10 and the bottom 10 countries for doing business, but many other countries' rankings are also shown. www.visualcapitalist.com/worlds-best-and-worst-places-for-business/
As students in my "Stock Market Challenge: Intro to Finance & Investment" class have experienced firsthand this semester, U.S. stock markets continue to experience significant volatility, with most indices down roughly 10-15% from their late-August/early-September highs. However, five countries (shown in red on this map) with export-sensitive economies are now experiencing bear market declines of 20% or more on their major exchanges. 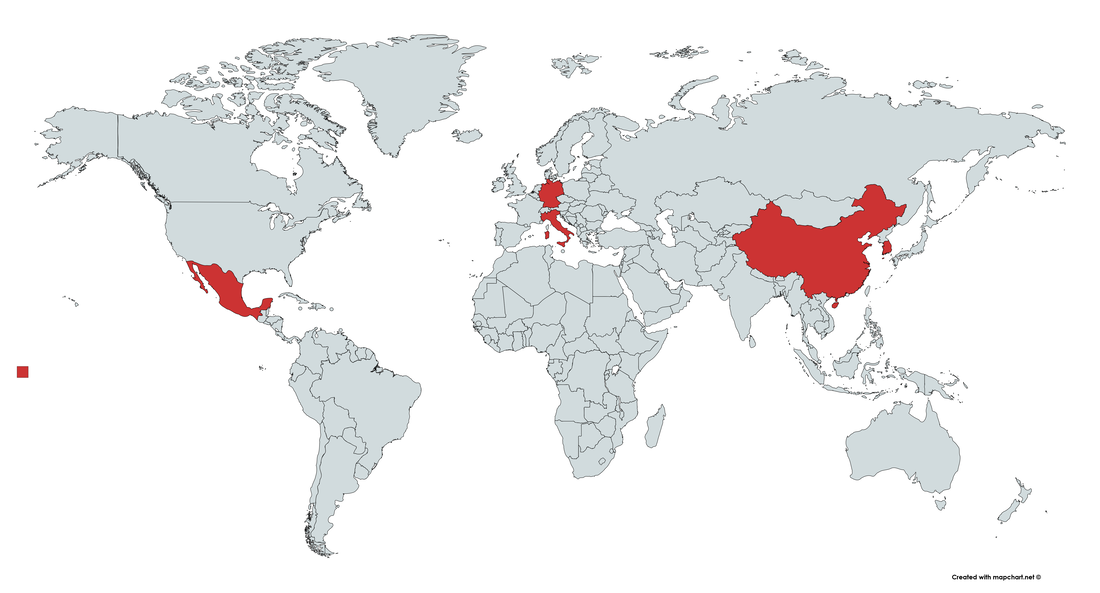 The London-based risk consultancy firm Control Risks has assembled its 2018 assessment of political and security risks, by country, by region within certain countries, and for bodies of water with piracy risks. Check it out at cdn-prd-com.azureedge.net/-/media/corporate/files/riskmap-2018/maps/riskmap-map-2018-uk-web.pdf
Leaders from around the world are currently meeting in Poland to discuss climate change. This interactive feature from The New York Times allows users to put in a location and a year to compare if and how climate has changed since that year and is likely to change. (Downside: because this feature focuses on 90+ degree days, only locations prone to 90-degree weather are searchable :-/.) www.nytimes.com/interactive/2018/08/30/climate/how-much-hotter-is-your-hometown.html
Despite being developed in the mid-1500s and having significant, known distortions, the Mercator projection continues to be used on popular maps, its familiar grid made easy for navigation. This map compares the landmasses from a Mercator map (in light blue) with their actual relative size (in darker blue).
www.reddit.com/r/dataisbeautiful/comments/9nkg7k/map_projections_can_be_deceptive_oc/ Interested in monitoring your own flight or that of friends or family (or even some random flight)? FlightAware provides real-time flight-tracking information. You can watch a flight divert around a storm system, see where your airplane is coming from (and if it's on time!), and check a flight's history of on-time arrival, among other things. flightaware.com/
If nothing else, this map that provides a literal "translation" of each country's name may spur further research and conversation: blogs.forbes.com/duncanmadden/files/2018/03/Literal-Translation-of-Country-Names.jpg
This interactive map highlights how global populations' access to electricity has changed since 1990. ourworldindata.org/grapher/share-of-the-population-with-access-to-electricity
The World Bank has announced that extreme poverty (defined as living on income of less than $1.90 per day) has fallen to a record low 10% of global population. These maps look at extreme poverty rates globally and by continent. howmuch.net/articles/people-living-in-extreme-poverty-2018
It has long been recognized that an earthquake in a given spot can trigger aftershocks in the same spot. But a new analysis of 40+ years of earthquake data reveals something more surprising: large earthquakes (with a magnitude of 6.5 and higher) also trigger earthquakes on the other side of the world. "After analysing 44 years of seismic data – from 1973 to 2016 – and comparing it to usual baselines of earthquake frequency, researchers from Oregon State University [found that] ... the higher the magnitude of the original earthquake, the more likely it is to trigger others. These secondary quakes would generally occur within 30 degrees of the antipodal point of the original epicentre (the point diametrically opposite it) up to three days after the initial event." geographical.co.uk/nature/tectonics/item/2925-earthquake-echoes
The World Bank's Human Capital Project seeks to measure whether countries' health and education systems are likely to lead to a productive workforce. Users of this site can shift between a variety of human capital variables, overall or by gender, or look at country-specific human capital data. www.worldbank.org/en/publication/human-capital
Between 2001 and 2015, the earth lost roughly 3 million square kilometers of forest. The specific reasons for the cutting of forests varies widely, though, based on location. This map, from Science News, analyzes the causes of deforestation. www.sciencenews.org/sites/default/files/2018/09/091318_LH_forest-loss_inline_730.png
This topological map looks at the world's coffee exporters. It is important to note that this is not the same as coffee growers: Europe, for example, grows no coffee but accounts for more than 1/3 of global export value (presumably by importing coffee beans and processing them into a higher-value product for re-export). howmuch.net/articles/world-map-of-coffee-exports
What makes a city "liveable"? According to The Economist (UK), liveability depends on stability, infrastructure, education, culture, environment, and health care. This geo-graphic and map shows the global cities deemed LEAST liveable by this metric. www.statista.com/chart/15062/global-cities-ranked-by-least-liveability/
This topological cartogram, based on data from the World Trade Organization, shows the countries of the world by the value of their exports. (This graphic does not include those countries that do not export at least $20 billion worth of goods, explaining the absence of parts of South America and most of Africa, among others.) howmuch.net/articles/largest-exporting-countries-2017
As a growing number of global patients are willing to travel for medical procedures that are more expensive or not available in their home countries, certain places are emerging as go-to spots for medical tourism. This map from The Economist (UK) shows a sampling of locations that have become known for specific procedures. www.economist.com/sites/default/files/imagecache/800-width/20180728_WBR974_0.png
A cartogram is a map that has been weighted for a particular variable. In this case, the variable is population experiencing heatwave disasters from 2001-2017. (A heatwave disaster is defined as having killed 10 or more people, having affected 100 or more people, having resulted in a declaration of a state of emergency, or having led to a call for international assistance.) Although India and Japan experienced the most heatwave disasters during this period, the most heatwave-related fatalities occurred in Russia, France, and Italy. worldmapper.org/maps/heatwaves-total-2001to2017
A new analysis of global satellite images published in the journal Science estimates that the earth's rivers and streams cover 44% more land than previously thought. Even so, rivers and streams still total only about 0.5% of the planet's nonglaciated land surface. This map shows rivers and their widths (blue=30+ meters, yellow=thousands of meters). www.sciencenews.org/article/earth-rivers-cover-44-percent-more-land-we-thought
To provide context for globalization, some of my "Hands-On Geography" classes study historical trade routes, and this map provides a nice look at trade networks crisscrossing the Eastern Hemisphere about 1,000 years ago. (Click on the link to see the zoomable map.) merchantmachine.co.uk/medieval-trade-routes/
The cost of bitcoin mining is directly proportional to the cost of electricity in a given area. This map compares the electricity costs involved in mining one bitcoin. Cheapest countries: Kuwait ($1,415) and Venezuela ($1,630). Most expensive: Solomon Islands ($80,189) and Belarus ($71,698). (Today's bitcoin price: $6,564.) Bitcoin mining alone now consumes more electricity, globally, than 173 countries. powercompare.co.uk/bitcoin-electricity-cost/
This pair of maps, based on data from the U.S. National Centers for Environmental Information, show the wettest and driest months of the year around the globe. (On both maps, pink and red are June and July, respectively.) www.city-data.com/forum/weather/2895681-driest-wettest-months-year-world-maps.html
The concern about plastics (in our landfills, in our waterways) seems to have accelerated since the airing of David Attenborough's "Blue Planet II" series. This map shows which countries have passed laws banning or limiting plastic bags and styrofoam. (Although several U.S. states and municipalities have acted on this issue, this map only considers national laws.) www.statista.com/chart/14120/the-countries-banning-plastic-bags/
This map from The Economist (UK) highlights some of the 104 countries that have laws prohibiting women from working in certain jobs -- or at all. "Some countries publish lists of jobs deemed too dangerous for women (Russia’s 456 include driving a train or steering a ship). Others stop women from working in entire sectors, at night or in 'morally inappropriate' jobs (in Kazakhstan women cannot bleed or stun cattle, pigs or small ruminants). In four countries women cannot register a business. In 18 a husband can stop his wife working." www.economist.com/graphic-detail/2018/05/24/billions-of-women-are-denied-the-same-choice-of-employment-as-men
|
Blog sharing news about geography, philosophy, world affairs, and outside-the-box learning
Archives
December 2023
Categories
All
|
 RSS Feed