|
Although COVID infections seem to again be tailing off in the U.S., they are still raging in countries like Vietnam, which is not only a major U.S. trading partner -- particularly for electronics, furniture, machinery, footwear, and textiles -- but also a key node in global supply chains more broadly. This map shows which industries are focused where in Vietnam: www.vietnam-briefing.com/news/wp-content/uploads/2014/06/MapVietnamSourcing.png
0 Comments
For decades, street vendors in south India have served a snack that botanists have been unable to identify. This article from Atlas Obscura chronicles the search for the plant and its cultural, economic, and biogeographic dimensions. www.atlasobscura.com/articles/indian-street-snack-root
China is experiencing a COVID outbreak in Fujian province (shown in red on this map). Fujian is north of Hong Kong and Shenzen, south of Shanghai, and directly across the Taiwan Strait from Taiwan. www.chinafolio.com/wp-content/uploads/2013/10/Fujian.jpg
This geo-graphic looks at who was granted asylum in the U.S. in FY2019, by country of origin, and how that mix has been changing. www.statista.com/chart/25619/asylum-grants-in-the-us-by-nationality
A new study, from a team of human geographers, analyzed satellite imagery of 913 major flooding events around the world from 2000 to 2018 and then compared population estimates in these same locations and discovered the population in flood-prone areas has grown by up to 86 million people, 10x faster than previously thought. Much of the population growth in floodplains has been part of the rural-to-urban migration in the Global South. www.washingtonpost.com/climate-environment/2021/08/04/tens-millions-people-have-been-moving-into-flood-zones-satellite-imagery-shows/
For those interested in learning more about Central Asia, including Afghanistan, the University of Indiana's Inner Asian and Uralic National Resource Center offers free videoconferences on a variety of topics, from the science and technology of the Silk Road to Aral Sea ecology to Inner Asian music and more. To put current events in context, there's also one that looks at the history and human geography of Afghanistan. The only catch: there's a minimum of 5 participants to reserve a slot. The center also offers educational materials for free loan (user pays postage). iaunrc.indiana.edu/resources/video-conferencing.html
Wildfires in California, British Columbia, Europe, and North Africa regularly make the news. But wildfires burning in Siberia are bigger than all of the others put together. "Siberia is so vast that huge fires can burn without threatening any major settlements, transportation systems or infrastructure — but are still part of a swath of infernos that together are larger than all the other blazes around the world. On one level, the Siberian fires are part of an annual cycle. But many climate experts see the staggering scope of this year’s fires as another sign of greater fire risks on a warming planet that is potentially being made even hotter by huge carbon emissions from the blazes. Russia is fighting more than 190 forest fires in Siberia that have closed airports and roads, forced widespread evacuations and sent a pall of smoke across the North Pole. But it has abandoned dozens more fires covering thousands of square miles, with no effort to fight them. ... More than 8,600 [Russian] firefighters, agricultural workers, soldiers and other emergency workers are fighting forest fires that have burned more than 62,300 square miles since the beginning of the year, according to Greenpeace. That’s an area nearly twice the size of Austria. ... Last year, Russian fires burned 4.7 billion trees, seven times more than were planted, according to a Greenpeace study using satellite images. In one month, Russian fires emitted carbon equal to Sweden’s total carbon dioxide emissions for the year."
www.washingtonpost.com/world/2021/08/11/siberia-fires-russia-climate/ As we are already seeing, changes in the climate do not have the same impact across all regions. This geo-graphic from Statista summarizes the changes in key elements of physical geography -- precipitation patterns and temperature -- forecast in this week's Intergovernmental Panel on Climate Change, by region. www.statista.com/chart/25511/scientific-consensus-climate-change-patterns-world-regions
And therein lies the rub: just days after the UN Intergovernmental Panel on Climate Change releases its bleak report on global warming, the Biden White House asks the OPEC+ group to pump more oil to bring down gasoline prices, which are at or near a seven-year high. OPEC+ refers to the official members of the Organization of Petroleum Exporting Countries, shown in dark blue on this map, and other major petroleum producers who often coordinate with OPEC but are not members of OPEC, shown in light blue on this map. www.insightsonindia.com/wp-content/uploads/2020/03/Break_through.png
Most of the plastic that ends up in the world's oceans enters via rivers, primarily Asian rivers that run through densely populated urban areas. In fact, a recent study finds that Asian rivers contribute more than 80% of the plastic that finds its way to the sea, with the Pasig River being the single largest source of plastic pollution. The Pasig is the river that bisects Manila, the capital city of the Philippines. According to this geo-graphic, three of the world's five most plastic-polluted rivers are in the Philippines. www.statista.com/chart/25005/riverine-plastic-emissions-by-continent
The primary case study in this New York Times article is Kobe, Japan, but the issues apply equally well to any coastal area in an earthquake zone, which includes much of the Philippines, Indonesia, Turkey, Greece, Italy, New Zealand, Chile, Mexico, the South Pacific, the Caribbean, and the U.S. Pacific coast, among many others: how does one build -- and pay for -- new sea walls that will not fail during the next earthquake? www.nytimes.com/2021/06/22/climate/san-francisco-sea-wall-earthquake.html
The U.S. military departure from Afghanistan -- and the Taliban's resurgence in many parts of the country -- have been in the news this week. (All U.S. troops are scheduled to be withdrawn from Afghanistan by August 31, with most combat troops having already left.) This map from The Economist (UK) shows the situation on the ground in Afghanistan as of earlier this week: www.economist.com/img/b/300/400/90/sites/default/files/20210710_ASM111.png
Although domestic tourism might be rebounding, the slow pace of vaccination in much of the world is expected to continue to depress international tourism. In fact, a recent UN report expects 2021 to be nearly as bad as 2020 in this regard, with estimates that global tourism will not return to pre-pandemic levels until 2023 or later. This geo-graphic shows the 10 countries that are expected to take the biggest hits to their economies in 2021 because of the lack of tourism. www.statista.com/chart/25202/gdp-losses-by-country-due-to-a-pandemic-related-reduction-in-tourism
On the one hand, the number of Chinese millionaires increased by 22% between 2019 and 2020 according to Credit Suisse. But according to an AfrAsia Bank report, China also lost more millionaires than any other country in 2019, with 16,000 high net worth individuals (defined as having assets of $1-10 million) emigrating from China that year. Turkey, however, saw the greatest proportion of its high net worth individuals leave in 2019 (8%). Where did they go? Australia was the top destination for HNWIs in 2019, followed by the U.S. www.statista.com/chart/25007/hnwi-emigration-by-country
Vice President Kamala Harris's recent trip to Guatemala to discuss illegal immigration reflects Guatemala's status as the #1 source country for people apprehended by the U.S. Border Patrol trying to gain illegal entrance to the United States. This map shows the top 10 source countries in FY2019, which is the most recent annual data released by the U.S. Border Patrol showing citizenship. The top two countries, by far, are Guatemala and Honduras which, together, accounted for more than 60% of all apprehensions. 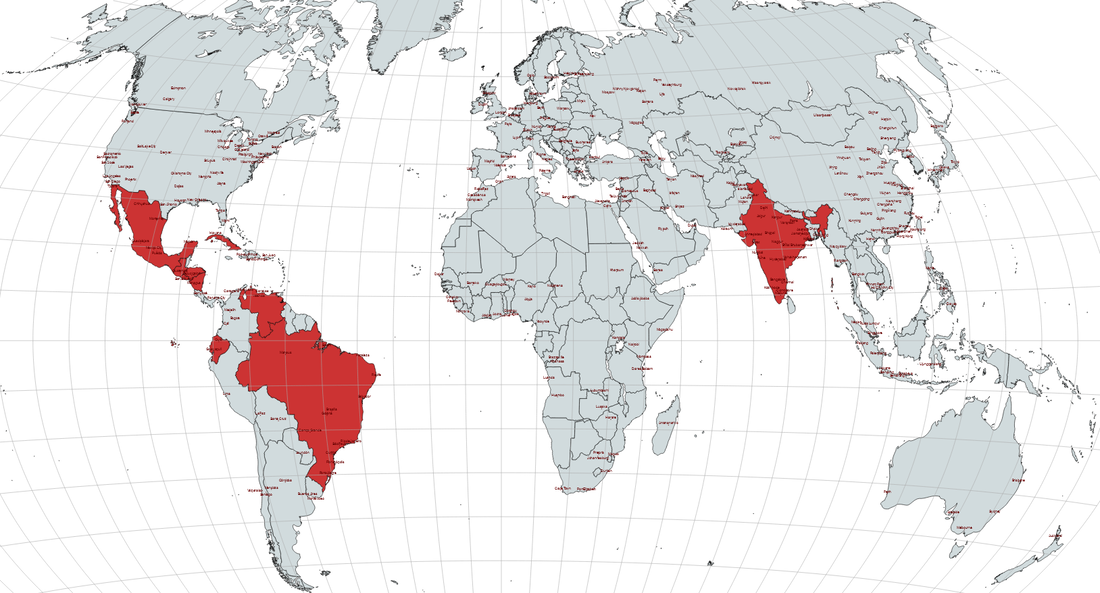 Earlier this week, the MV X-Press Pearl, bound for Colombo, Sri Lanka, caught fire and sank, releasing 78 tons of plastic pellets into the Indian Ocean, tens of millions of which are now covering Sri Lanka's beaches. The plastic pellets aboard the MV X-Press Pearl were to be used in the production of plastic bags. This geo-graphic looks at single-use plastic waste by country: www.statista.com/chart/24874/single-use-plastic-waste-generated-per-person-in-selected-countries
The Dayak people of Indonesia and Malaysia celebrate their heritage with an annual festival on June 1 every year that includes this intricate layer cake https://www.atlasobscura.com/articles/kek-lapis-sarawak
Under the World Bank and International Monetary Fund's Debt Service Suspension Initiative, 73 of the world's poorest countries have been eligible to suspend payments on external debt through Dec. 2021 in order to "concentrate their resources on fighting the pandemic and safeguarding the lives and livelihoods of millions of the most vulnerable people." This interactive map from HowMuch.net allows users to see which countries (in pink) have taken advantage of the DSSI program and, perhaps more interesting, which other countries hold that debt (in blue after clicking on a pink country). howmuch.net/articles/the-state-of-external-debt
Like the hurricane season in the northern Atlantic Ocean, the cyclone season in the northern Indian Ocean is generally at its most intense from May to November. Over the last week, the cyclone season began with Cyclone Tauktae (Burmese for "gecko"), the biggest storm to hit the north coastal Indian state of Gujarat in more than 20 years. (Moving nearly 200,000 people in low-lying areas to shelters has also raised concerns about the spread of COVID in the coming weeks.) This satellite image shows Tauktae as it approached Gujarat: c.ndtvimg.com/2021-05/4uaunabc_cyclone-tauktae650_625x300_17_May_21.jpg
According to the UN Environment Programme, the world wastes nearly a billion tonnes of food per year. This geo-graphic shows both the quantity of food waste in absolute terms in selected countries (orange bars) and the quantity of food waste per capita (in yellow circles). The reasons for food waste vary with the country; in poorer countries, waste may result from inefficiencies in field-to-table logistics, for example, whereas in wealthier countries more of the waste may be generated by the food service industry. www.statista.com/chart/24350/total-annual-household-waste-produced-in-selected-countries
Students in my "Hands-On Geography" and "Geography: Live Online!" classes learn about the relationship between tectonic plates and various geographic features. This map, based on the movement and rifting of the African Plate, shows what Africa, southern Europe, and western Asia are anticipated to look like in 10 million years. www.reddit.com/r/MapPorn/comments/n44s8b/africa_10_million_years_later_based_on_current/
A recent study published in Nature Geoscience finds that 64% of arable land worldwide -- including much of the world's most productive, intensively farmed land -- is at risk of poisoning by pesticides. The problem is most severe in China, Japan, Malaysia, and the Philippines. This map shows the areas at greatest risk (the darker the color, the greater the projected risk). scitechdaily.com/64-of-farmland-at-risk-of-pesticide-pollution-revealed-in-global-map-of-agricultural-land-across-168-countries/
In advance of Earth Day, this geo-graphic looks at the 20 global cities with the worst air pollution, as measured by particulate matter. Although the Chinese city of Hotan, on the southern edge of the Taklamakan Desert, tops the list, 18 of the 20 cities with the worst air pollution are in South Asia. www.statista.com/chart/17239/average-level-of-particulate-matter-pollution
Fifty years ago, during the Vietnam War, the U.S. dropped roughly 2 million tons of ordnance on Cambodia. Many of the bombs that fell in soft soil didn't explode, leaving a legacy of unexploded ordnance that affects patterns of agriculture in Cambodia to this day. www.economist.com/graphic-detail/2021/03/20/american-bombing-50-years-ago-still-shapes-cambodian-agriculture
Because warmer air can hold more moisture, humidity is expected to rise along with global temperatures. A recent study published in Nature Geoscience suggests that the combination could push human life in the tropics to the breaking point. "Humans’ ability to regulate their body heat is dependent upon the temperature and humidity of the surrounding air. We have a core body temperature that stays relatively stable at 37C (98.6F), while our skin is cooler to allow heat to flow away from the inner body. But should the wet-bulb temperature – a measure of air temperature and humidity – pass 35C, high skin temperature means the body is unable to cool itself, with potentially deadly consequences. ... The research team looked at various historical data and simulations to determine how wet-bulb temperature extremes will change as the planet continues to heat up, discovering that these extremes in the tropics increase at around the same rate as the tropical mean temperature. ... This has potentially dire implications for a huge swathe of humanity. Around 40% of the world’s population currently lives in tropical countries, with this proportion set to expand to half of the global population by 2050 due to the large proportion of young people in region. The Princeton research was centered on latitudes found between 20 degrees north, a line that cuts through Mexico, Libya and India, to 20 degrees south, which goes through Brazil, Madagascar and the northern reaches of Australia. ... '“Theoretically no human can tolerate a wet bulb temperature of above 35C, no matter how much water they have to drink,' [Boise State climate risk expert Mojtaba Sadegh] added."
www.theguardian.com/science/2021/mar/08/global-heating-tropical-regions-human-livability |
Blog sharing news about geography, philosophy, world affairs, and outside-the-box learning
Archives
December 2023
Categories
All
|
 RSS Feed